More large trucks are causing fatalities, according to the National Highway Traffic Safety Administration. The latest data analyzed by the National Safety Council shows truck-involved fatalities are trending up.
The NHTSA recently published its data on fatal crashes involving large trucks for 2022—the most recent data available—and fleets of all sizes could gain insight, as the data classifies large trucks as vehicles with a GVWR of 10,000 lb. and greater, identifying both medium- and heavy-duty trucks as “large trucks.” Additionally, both commercial and non-commercial trucks were included in the data.
The National Safety Council breaks down the upward trend, who is most affected by these fatal crashes involving large trucks, when and where these crashes take place, and which states have the most and least fatal crashes involving trucks.
See also: Three studies find the states where driving is considered the riskiest
An upward trend
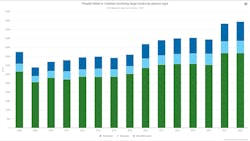
From 2021 to 2022, large trucks involved in fatal crashes increased by 1.8% to 5,837 trucks. This is a 49% increase over the last decade. Further, the rate of large trucks’ involvement in fatal crashes is also rising per million truck miles traveled, with an increase of 3% from 2021 and an increase of 24% over the last 10 years.
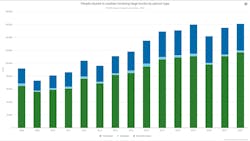
Some 120,200 trucks were involved in crashes that resulted in an injury in 2022. This is an increase of 2.5% from 2021 when 117,200 trucks were involved in crashes resulting in injury. This reflects a total increase of 18% since NHTSA began using the Crash Report Sampling System to collect data on trucks involved in accidents leading to an injury in 2016.
Before 2016, NHTSA used a different method to determine truck-related injuries, which isn’t directly comparable to the CRSS. The chart below indicates the change in data collection method with years prior to the CRSS identified in green and CRSS years identified in blue.
See also: CVSA Brake Safety Week yields predictable results
Who is most affected by truck crashes
Traffic accidents that result in an injury or fatality not only affect those involved, but also their families, the business that employs the driver, and more. However, the following data pertains to those directly involved and affected by injuries or those who have succumbed to them.
A total of 5,936 individuals lost their lives due to traffic accidents involving a large truck in 2022. This number is up by 2% from 2021 with a total of 5,821 lives lost. Over the last 10 years, this number has increased by 49%.
Occupants of the other vehicle make up the majority of those injured or killed due to these accidents, followed by the truck occupant(s), and then pedestrians or cyclists. In 2022, 70.4% of the individuals killed in an accident involving a large truck were occupants of the other vehicle, whereas 18.5% of those killed in the accident were occupants of a large truck. Pedestrians and cyclists made up the remaining 11.1%.
The data breakdown for injuries resulting from a large-truck crash looks much the same, although the rate of injuries compared to fatalities is much higher.
Roughly 161,000 injuries occurred from large-truck accidents in 2022, up by 3.9% from 2021. Occupants of other vehicles received the majority of these injuries (72.7%), and the truck occupants took on 26.1%. Pedestrians and cyclists were injured by less than 2%.
See also: What Clearinghouse-II will bring in November
When and where these accidents took place
Most of the truck-involved accidents that resulted in an injury or fatality occurred in rural areas during the day. The highest amount of accidents occurred in June, August, September, and October.
The graphics and the bulleted lists below provide more insight into the conditions and times of these accidents.
Where the accident took place
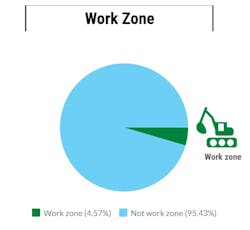
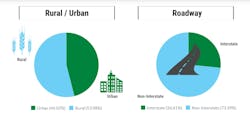
Most truck-involved accidents took place in rural areas compared to urban areas, which typically have more congestion. These accidents occurred on non-interstate roads compared to interstates where speed limits are typically much higher. Further, most accidents took place in areas that were not considered working zones.
- Rural area accidents: 53.98%
- Urban area accidents: 46.02%
- Non-interstate accidents: 73.39%
- Interstate accidents: 26.61%
- Accidents not in a work zone: 95.43%
- Accidents in a work zone: 4.57%
When the accident took place
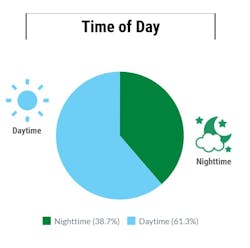
Most truck-involved accidents that resulted in a death or injury took place during the daylight hours compared to nighttime, when visibility is typically limited.
- Daytime accidents: 61.3%
- Nighttime accidents: 38.7%
More accidents occurred in the summer months of June and August as well as the autumn months of September and October.
See also: FMCSA further tweaks its CSA overhaul
Data breakdown by U.S. state
In line with the data about accidents occurring in rural areas, the states with the highest percentage of trucks involved in fatal crashes for 2022 are also some of the most rural. North Dakota has the highest percentage of truck-involved accidents that led to a fatality, followed by Wyoming and Iowa. New Mexico, Nebraska, and Montana tied for fourth.
Here are the states with the highest percentage of truck-involved fatal crashes:
- North Dakota – 23%
- Wyoming – 21%
- Iowa – 16%
- New Mexico – 15%
- Nebraska – 15%
- Montana – 15%
On the other end of the spectrum, the states with the lowest percentage of fatal crashes involving a truck are:
- Hawaii – 4%
- Maine – 4%
- California – 7%
- Connecticut – 7%
- Florida – 7%
- Maryland – 7%
- Michigan – 7%
- Nevada – 7%
- Rhode Island – 7%
The states with the highest total deaths occurring from a truck-involved crash are:
- Texas, with 810 deaths;
- California, with 436 deaths; and
- Florida, with 368 deaths.
States with the fewest total deaths from accidents involving large trucks are:
- District of Columbia, with 3 deaths;
- Rhode Island, with 5 deaths; and
- Hawaii, with 6 deaths.


