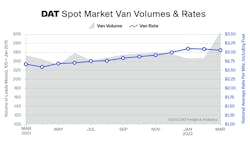
While truckload volumes reached historic highs in March, spot rates fell last month as fuel prices soared and supply inched closer to the freight market demand. These shifts are signs of a softening freight market, which could impact smaller carriers and independent operators this spring.
“Moderating spot rates and falling load turndown data suggest that the relationship between demand and supply are becoming more equally balanced, as freight growth slows and driver capacity growth persists,” according to Kenny Vieth, ACT Research president and senior analyst.
See also: Diesel prices turn back northThe weakening spot market rates and historic diesel prices in March overshadowed more robust truckload freight volumes and record-high contract freight prices, according to DAT Freight & Analytics.
DAT’s March Truckload Volume Index (TVI) for dry van freight was 305, up 23% compared to February; the refrigerated TVI was 206, a 13% increase; and the flatbed TVI was 247, up 24% month over month. The increases reflect more loads moved last month and March having more shipping days than February.
“What made March unique is that shippers paid historically high prices to ensure that more of their loads moved under a longer-term contract, reducing their need for trucks on the spot market and causing rates to soften,” said Ken Adamo, DAT’s chief of analytics. “At the same time, carriers’ operating costs increased because of higher fuel prices. As a national average, fuel costs $1.07 per gallon more in March than February and $1.95 a gallon more year-over-year.”
Small trucking companies and independent operators experienced significantly higher operating costs and lower revenues than they’ve become accustomed to over the past couple of years, Adamo said.
Added Vieth: “While we acknowledge the roll-off from peak activity, some of the giveback that began in March was the return of labor on diminishing omicron COVID case counts: Much of the 10% spot rate decline tracks rates to pre-omicron levels.”
Contract freight rates reach record highs
Van freight contract rates increased 19 cents to $3.28 per mile as a national average in March—surpassing the record highs set in February, according to DAT. The average contract reefer rate was $3.45 a mile, up 20 cents, while the flatbed rate gained 24 cents to $3.69 a mile.
On the spot market, DAT reports the national average van rate fell to $3.06 per mile, down 3 cents compared to February. Spot reefer rate was $3.44 per mile, down 9 cents. The flatbed rate was $3.45 per mile, up 26 cents month over month and a new record.
Spot truckload rates, negotiated as one-time transactions between freight brokers and carriers, incorporate a fuel surcharge. Without the surcharge, spot van rates fell 21 cents in March to a $2.42-per-mile average; reefer dropped 28 cents to $2.74 per mile; flatbed rate went up 5 cents to $2.68 per mile.
“The roughly 15% drop in truckload spot rates, net fuel, since January has obviously been a big topic of discussion,” Tim Denoyer, ACT Research VP and senior analyst, said this week. “We think most of this decline is the reflection of the Omicron effects that tightened capacity a few months ago, combined with ongoing progress on the hiring front. A few points are also due to the inability of the spot market to pass through higher fuel prices, leading to an extraordinary hit to rates, ex-fuel.”
Truck supply begins to outpace freight demand
Despite the weakening spot rates during Q1 of 2022, they remain higher than this time in 2021, when fuel averaged $3.15 a gallon, according to DAT.
In March 2021, DAT reported the national average van rate was $2.67 per mile; the reefer rate was $2.95 a mile; the flatbed rate was $2.78 a mile. Spot-market loads continued to be abundant. There were 3.7% more loads posted to the DAT load board network in March 2022 compared to March 2021.
However, according to DAT analysis, there are signs that the supply of trucks on the spot market outpaced demand: The national average van load-to-truck ratio fell to 4.6, down from 7.3 in February, meaning there were 4.6 available loads for every van on the DAT network. The reefer load-to-truck ratio was 8.4, down from 13.7. The flatbed ratio increased from 83.9 to 89.8.
Freight rate cycle slowing
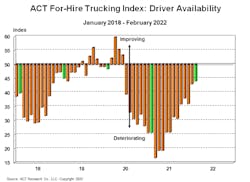
The ACT For-Hire Driver Availability Index again showed signs of improvement—posting its highest number since before the COVID-19 pandemic began more than two years ago. But more than a month since Russia invaded Ukraine and created more economic uncertainty around the world, other domestic freight-related metrics are slowing, according to ACT’s State of the Industry: North American Classes 5-8 Report, released on April 18.
Denoyer said the driver index returned to levels “where freight rates turned down in late-2018 and 2019, as labor has recovered strongly from the omicron variant of COVID-19. We’re now in the late-cycle slower stage of the cycle, where ongoing slowing in freight volume and progress on capacity are ultimately deflationary for the rate cycle.”
Despite this, overall freight volumes continue to grow this year as businesses are still in a restocking mode as the industry still deals with port backlogs that have eased but continue to persist. “Supply disruptions will continue, with the truck manufacturing cycle at heightened risk, which may result in tighter equipment capacity than currently expected, impacting market dynamics,” Denoyer said. “Freight volumes have mainly weakened in the spot market, where load/truck ratios and load turndowns are falling sharply. While part of the transition to the late stage of the cycle, the broader market is not in freight recession yet.”
Recent “press hysterics” about negative freight metrics don’t take a holistic view of the market, according to Vieth. That view “shows still-strong and wide economic underpinnings, from corporate earnings to industrial metrics to consumer balance sheets,” he explained. “And, the inflation-driven slowdown that is occurring is happening in a market where pent-up demand is the rule.
“To that end, the economy remains a secondary risk to expectations. The greater risks to the downside through the balance of 2022 and into 2023 remain ones of supply, with Ukrainian neon and Chinese zero-COVID lockdowns at the top of the list of causes that could push vehicle output below expectations.”


