The bullet points are telling…
- Most fatal trucking crashes occur between 11 a.m. and 4 p.m., peaking at the 1 p.m. hour with 676 fatal crashes (over a three-year span).
- I-10 is the most fatal road in the nation for trucking crashes.
- More than 21% of all large-truck drivers involved in fatal crashes had at least one prior speeding conviction, nearly the same number as that of passenger car drivers involved in fatal crashes.
- Failure to yield the right of way was the most common truck driver behavior related to fatal truck crashes.
The information comes from a study entitled ‘An analysis of fatal truck accident statistics.’ It was conducted by Phoenix, AZ truck accident attorneys with the firm of Begam Marks & Traulsen, P.A., in collaboration with 1POINT21 Interactive, a full-service digital agency based in San Diego, CA.
“We analyzed three full years (2015-2017) of national traffic collision data to present every truck accident statistic, fact and insight available,” explained Samantha Larson of 1POINT21.
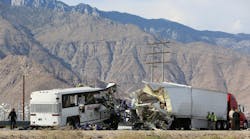
From 2015-2017, large trucks were involved in nearly 11,000 fatal crashes on U.S. roadways-killing 12,230 people, according to the study.
In the U.S., nearly 70% of all freight is transported by truck, accounting for $671 billion worth of manufactured and retail goods being transported by truck every year. According to the National Highway Traffic Safety Administration (NHTSA), in 2015 there were 11,203,184 large trucks registered, while in 2016 that number increased to 11,498,561 (NHTSA, 2019). Clearly, we are highly dependent upon large trucks.
Large trucks accounted for 9% of the vehicles involved in fatal accidents in 2017. Of the 4,657 large trucks involved in those crashes, 69% were combination trucks (tractor-trailer, doubles, straight truck with trailer, etc.).
Additionally…
- According to NHTSA statistics, fatal incidents involving tractor trailers rose 5.8% in 2017 from 2016, and accidents involving straight trucks (those not part of a tractor-trailer) were up by 18.7%.
- Between 2015 and 2017, the number of occupants in passenger vehicles killed ranged from two in the District of Columbia to 1,358 in Texas.
- Also, between 2015 and 2017, 33 states each had more than 100 occupants of other vehicles killed in large-truck crashes, 21 had more than 200, and 10 had more than 300 fatalities as a result of a large truck crash accident.
- In 2017, the largest percentage of drinking drivers involved in fatal crashes and who had blood alcohol concentrations (BACs) of .08 g/dL or higher were 1) motorcycle drivers (27%), 2) passenger car drivers (21%), 3) light truck drivers (20%), and then 4) heavy truck drivers (3%). These numbers were similar in the previous two years (NHTSA, 2019).
- Large-truck drivers did, however, have a higher percentage (20.7%) of previously recorded crashes compared to drivers of other vehicle types (motorcycles, 20.3%; passenger cars, 19.1%; light trucks, 17.0%).
When do fatal truck crashes occur?
Most fatal trucking accidents occur on weekdays, with the fewest occurring on Sundays by far (701 fatal crashes), followed by Saturday (1,026).
At the same time, fatal crashes do not coincide with typical rush hours. In fact, the most crashes occur during 11 am and 4 pm, peaking at the 1 pm hour with 676 fatal crashes.
Where do fatal truck crashes occur?
The majority of fatal trucking crashes occur in rural areas on interstate highways and primary arterial roads. The 10 roads with the most fatal trucking crashes include, ir oder from one to 10: I-10; I-40; I-95; US-75; I-20; I-80; I-70; I-5; I-35 and I-15. At the state level, the highest number of fatal truck collisions occurred in Texas, with 1,358 crashes, followed by: CA, FL, GA and PA.
Who gets killed most often?
The vast majority of deaths involving large truck crashes are passenger vehicle occupants. Passenger vehicles are especially vulnerable in crashes with large trucks simply because of their smaller size; trucks can weigh 20-30 times as much as a passenger vehicle and can be taller, with greater ground clearance. This can result in underride crashes, where the car slides under the truck itself, often resulting in devastating injuries for the car occupants.
Why are there crashes?
When noted in the crash report, a truck driver’s failure to yield the right of way was the most common factor related to the crash. Here are the rest of the top 10, from second most common failure to least most: careless driving; improper lane usage; failure to obey traffic signs and signals; following improperly; over-correcting; stopping in roadway; erratic operation; improper lane change; making an improper turn.


