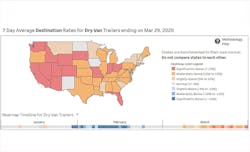
Thirteen states have significantly higher destination rates for dry van trailers than normal due to increasing demand amidst the unprecedented national shutdown that hopes to slow the spread of the deadly COVID-19, while half of the continental U.S. recorded moderately higher rates for that category, according to a heat map created by FTR. Seven stayed the same and only four were normal.
The transportation intelligence company, which developed the Freight cast forecasting model, used Truckstop.com spot market data for the seven-day period ending on March 29 and compared it against the last five years from the same week, along with data from January 2020, prior to the threat of the coronavirus being widely disseminated to the public. FTR included origin and destination data for dry van, refrigerated, flatbed and specialized trailers.
“The coronavirus pandemic is unlike anything we’ve ever seen in the industry,” said Brent Hutto, chief relationship officer for Truckstop.com. “It is more important than ever to give freight industry professionals accurate, up-to-date information so they can make informed decisions and keep our nation moving.”
The data was made publicly available by FTR to arm the trucking industry with insights to help them on their challenging mission to resupply the nation.
“Truck drivers and the companies that employ them are on the front lines of America’s response to the coronavirus crisis. Trying to keep up with the myriad state and local restrictions and fluctuating conditions can be overwhelming, but as markets often do, truck spot rates naturally reflect these stresses,” said Avery Vise, FTR vice president of trucking. “By showing how rates in individual states deviate from what FTR assesses to be the norm absent the COVID-19 crisis, we believe we are providing a valuable analytical tool to shippers, brokers, and carriers and even to those who simply want to understand how the crisis is affecting U.S. commerce.”
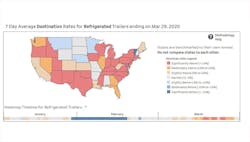
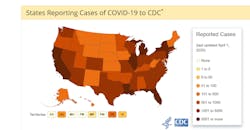
Users can dig into the interactive heat map to uncover a wide range of insights, though states should not be compared to each other based on the data, the company warned. The reefer destination heat map matches up closely with the Center for Disease Control map for reported COVID-19 cases, which as of April 1, were at 186,1010:


