The freight industry continues to grapple with low rates and volumes. Excess carrier capacity contributes to this drawn-out freight recession; there are still roughly 15% more drivers today than in March 2020, according to analysts at FTR Transportation Intelligence.
April saw continued month-over-month and year-over-year declines across volumes, pricing, and more, according to monthly freight market reports from ACT Research, the American Trucking Associations, and the Bureau of Transportation Statistics.
Further declines across the board
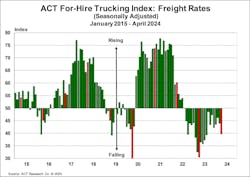
ACT’s For-Hire Trucking Index decreased 6-10%, month over month, across all five of its index categories in April.
The For-Hire Trucking Index is a set of five seasonally adjusted diffusion indexes: volume, pricing, capacity, productivity, and drivers. ACT bases its indexes on surveys of for-hire carriers. A score of 50 or greater indicates growth among for-hire carriers, while a score below 50 indicates degradation.
The Volume Index in April was 41.7, down nearly 9% from March’s score of 45.8. ACT attributes some of the for-hire volume decrease to a temporary volume shift toward private fleets.
The Pricing Index was 39.7, down 9.6% from last month’s score of 43.9. However, ACT suggests that rates will soon recover as bid season heats up.
The Capacity Index fell to 44.2, a decrease of 6.4% from last month’s 47.2. Low rates and rising operational costs continue to push capacity out of the for-hire market. For example, April’s Class 8 vehicle order activity decreased both month over month and year over year.
The Productivity Index was 45.4, down 6.4% from 48.5 last month. The drop is consistent with a decreasing Volume Index.
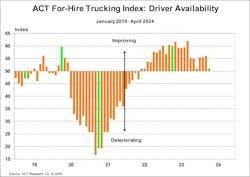
The not-seasonally-adjusted Drivers Index—measuring driver availability—fell to 51, a 8.9% decrease from last month’s 56. Driver availability has remained persistently high since 2022, though it may soon begin a cyclical downturn.
Freight volumes fell, says ATA
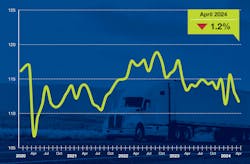
ATA’s Truck Tonnage Index for April equaled 111.7—down 1.2% month over month and 1.5% year over year.
The Index measures seasonally-adjusted freight volumes hauled by surveyed member fleets. A score of 100 on the index represents ATA’s measured freight volumes from 2015.
April’s Index score is the 14th straight month of year-over-year declines.
“The truck freight market remained soft in April as seasonally adjusted volumes fell for the second straight month,” Bob Costello, ATA’s chief economist, said in a press release. “With a rebound in freight remaining elusive, it is likely that additional capacity will leave the industry in the face of continued softness in the market.”
Trucking employment flat in April
While ACT’s index report suggested waning capacity, BTS’s data for April did not record significant decreases in trucking employment.
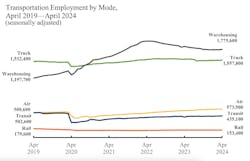
Seasonally adjusted, employment in trucking for April remained virtually unchanged from the previous month at 1,557,800, according to BTS —however, this was down 1.3% from last year.
Since BTS began recording transportation sector employment in 1990, trucking employment reached its all-time high in July 2022 at 1,587,900. Employment remained steady until a 2% drop in August 2023 and has been relatively stable since.
BTS’s employment data generally fails to represent small fleets and owner-operators, even though 64.7% of motor carriers operate only one truck.
“The smallest carriers ... do not show up in the monthly Bureau of Labor Statistics data because they’re not part of the unemployment system,” Avery Vise, FTR’s VP of trucking, said during a May 9 FTR webinar. “They’re not actually employees, they’re sole proprietors—essentially living off the delta between spot rates and fuel costs.”
If the freight recession is pushing capacity out of the market, BTS data suggests that it is happening among those small, underrepresented businesses.
About the Author
Jeremy Wolfe
Editor
Editor Jeremy Wolfe joined the FleetOwner team in February 2024. He graduated from the University of Wisconsin-Stevens Point with majors in English and Philosophy. He previously served as Editor for Endeavor Business Media's Water Group publications.


