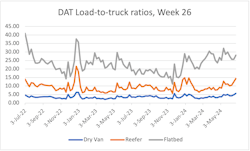
The week before Independence Day brought promising developments for the U.S. spot market.
Load postings increased significantly, while the number of available trucks fell for all equipment types—pushing rates upward—according to the latest weekly spot market data from transportation research firms DAT Freight & Analytics and FTR Transportation Intelligence.
More loads, fewer trucks
Both firms found that load postings increased significantly while truck postings decreased, bringing a welcome increase to the spot market’s load-to-truck ratio. Load postings saw year-over-year increases across all equipment types.
DAT found that load posts in DAT One had increased 8.4% to 2.37 million last week, while truck posts decreased by 3.4% to 320,880. This is the fourth straight week of declining truck posts for DAT One. Year over year, load posts remained virtually unchanged from 2023, while truck posts fell 16%.
Dry van loads rose to 1,208,382, up 13% from the previous week and up 3% from last year. The number of available dry van trucks dropped by 2.6% to 213,596.
“Dry van load-post volume typically increases during the last week of June, coinciding with the end of the quarter and the last full shipping week before the July 4 holiday,” noted Dean Croke, principal analyst for DAT. “Volumes were 3% higher than week 26 last year, and the van load-to-truck ratio was the third-highest reading in eight years. Only 2018 and 2021 recorded higher LTR for the week before Independence Day.”
Refrigerated loads increased 7.1% to 532,018, an increase of 7% year over year. The number of available equipment dropped by 7% to 60,857.
“Reefer load posts increased by 7% last week but were still 7% lower than last year due to softer produce volumes,” Croke said. “Truckload produce volumes typically increase by 8 to 10% week over week in the lead-up to July 4, but last week's volumes were down 4%. California, which produces around a third of truckload produce volumes, was down 6% week over week.”
Flatbeds faced a similar trend, though less extreme: Loads rose by 1.5%, reaching 637,232 and leaving no year-over-year change. Meanwhile, available equipment was down 1.7% at 46,427.
FTR reported that its measured total load activity—measuring freight volume in the Truckstop system—increased 10.2% over the previous week and was about 7% above the same week last year. However, volume is still 25% below the week’s five-year average.
Total truck postings declined 0.7% over the previous week. This helped move FTR’s ratio of load postings and truck postings to its highest level in three weeks.
Dry van loads jumped 16.9% from the previous week, landing it nearly 7% above the same week in 2023. However, dry van loads for the week were still almost 17% below their five-year average. Refrigerated loans increased 14% week over week, up more than 1% year over year but still 24% below the week’s five-year average. Flatbed loads rose 4.1% from the previous week, rising more than 12% year over year but still roughly 35% below the five-year average.
Overall rate increases
Average spot rates overall increased last week, though results between equipment types were mixed. DAT found that rates increased across all three equipment types, while FTR recorded rate increases only for dry van loads.
DAT reported a rise in linehaul spot rates for all three equipment types in DAT One. The average dry van linehaul rate rose by 1 cent to $1.70 per mile net fuel; the reefer rate increased 3 cents to $2.03; and the flatbed rate rose 2 cents to $2.08.
“At $1.70 a mile, the national average dry van linehaul rate was the highest since the Polar Vortex event in mid-January,” Croke said. “The rate averaged $2.06 a mile on DAT’s Top 50 van lanes based on the volume of loads moved, up 3 cents week over week and 36 cents higher than the national average.”
FTR’s weekly report found that the total broker-posted rate in Truckstop increased only 0.4 cents per mile after declining more than 3 cents per mile the previous week. Total rates decreased 1.5% year over year, sitting 9.5% below the five-year average for the week. However, an increase of even a fraction of a cent is noteworthy: FTR’s week 26 had consistently decreased week over week since 2021.
Average spot rates for brokers’ dry van postings rose nearly 5 cents per mile from the previous week. Dry van rates also decreased 0.5% from the previous year, sitting 11% below its five-year average for the week.
Refrigerated spot rates declined 0.4 cents per mile week over week, down 1.5% year-over-year, and landing rates 9.5% below their five-year average for the week.
Flatbed rates declined more than 1 cent from the previous week, down only about 1% from last year and 9% below the five-year average. For flatbed rates, this 1% decrease from 2023 was the strongest year-over-year change since July 2022.
About the Author
Jeremy Wolfe
Editor
Editor Jeremy Wolfe joined the FleetOwner team in February 2024. He graduated from the University of Wisconsin-Stevens Point with majors in English and Philosophy. He previously served as Editor for Endeavor Business Media's Water Group publications.


