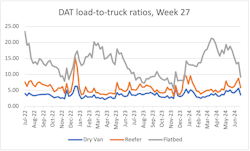
Last week’s spot market faced drastic week-over-week declines in loads and trucks, typical for the week of Independence Day where the prior week is one of the busiest on the freight calendar.
Many businesses had reduced workdays last week, suppressing load volumes by more than 40%, according to weekly spot market data from DAT Freight & Analytics and FTR Transportation Intelligence.
See also: Diesel prices up for fourth week, gas $3.49/gal
Typical plummet for load volumes
A shortened workweek led to drastically fewer loads and trucks. Both DAT One and Truckstop received roughly 45% fewer load postings than the week prior and 18% fewer truck postings across all equipment types.
DAT reported that the total number of loads posted on DAT One dropped 48% last week—falling from 2.37 million the previous week to 1.26 million. The number of truck postings also fell, though not as drastically, dropping 21% to 262,943.
According to DAT, dry van load postings dropped 49.9% to 618,011, while truck postings dropped 21.9% to 172,876. Refrigerated load postings declined 42.6% to 317,301, while truck postings fell 15.4% to 54,335. Flatbed postings were down 49.2% to 326,464, and truck postings dropped 25.9% to 35,632.
FTR reported a significant drop in load and truck postings, similar to DAT's report.
Total load activity, a measure of freight volume in the Truckstop system, fell 43.1% compared to the previous week. Load activity was down 11% year over year and nearly 47% below FTR’s five-year average for the week. Additionally, total truck postings fell 16.1%. This brought FTR’s load-to-truck ratio to its lowest level since December.
Dry van loads in Truckstop fell 43.7%, down 13% year over year and sitting 42% below the week’s five-year average. Refrigerated loads fell only 29.5%, a year-over-year increase of 4% but still 34% below the five-year average. Flatbed loads, meanwhile, plunged 47.1%, bringing it down 13% from the previous year and more than 56% below the week’s five-year average.
Across both firms’ reports, dry van and flatbed loads faced the greatest week-over-week decreases. Refrigerated loads also fell drastically, though to a lesser degree.
Relatively stable spot market rates
While volumes plunged, spot market rates were much more stable.
DAT reported mixed results for spot market linehaul rates, with the average rate across all equipment types dropping by 1 cent. Dry van rates averaged $1.70, the same rate as the prior week but a decrease of 2.2% from the same week last year. Refrigerated rates averaged $2.04, up by 1 cent week over week but down 1.5% year over year. Lastly, flatbed rates fell by 3 cents to $2.05 but saw a smaller year-over-year decline of 0.4%.
FTR found that the average broker-posted rate in Truckstop across all three equipment types increased by 1.7 cents. Total rates were down only 0.1% year over year—which is FTR’s strongest year-over-year comparison since June 2022—and 7% below the five-year average for the week. Dry van and refrigerated rates increased, while flatbed rates continued to decline.
Average dry van spot rates in Truckstop rose 1.7 cents week over week—up 2% year over year but still 8% below the five-year average. Refrigerated rates rose 7.4 cents, an increase of 8.5% from the previous year yet 2% below the five-year average. Flatbed rates fell 0.7 cents, down 2% year over year and 8% below the five-year average.
Both firms reported that reefer rates benefited the most from the previous week, rising 1 cent in DAT One and 7.4 cents in Truckstop.
What’s in store for the spot market this week?
This week, inclement weather could affect freight in the Gulf Coast, and a risk of labor strikes could shift goods away from East Coast ports, according to Dean Croke, principal analyst for DAT.
The Gulf Coast faces major disruptions from Hurricane Beryl.
“Hurricane Beryl made landfall near Matagorda, Texas, about 85 miles south-southwest of Houston, packing maximum sustained winds of 80 mph,” Croke said. “Truckload capacity tightened in Gulf Coast markets, especially for van and flatbed freight.”
Moreover, imports may shift away from the East Coast due to a risk of port union strikes over unresolved contract disputes.
“Import volumes at the Ports of Los Angeles and Long Beach are expected to increase 45% year over year in the second week of July as shippers pull forward holiday season inventory ahead of possible East Coast labor action by the International Longshoreman Association,” Croke said. “Key outbound lanes include Stockton and Phoenix, where loads moved are already up 45% and 28% month over month, respectively. On the same lanes, spot rates are up 3.5% and 4.5% m/m, respectively.”
About the Author
Jeremy Wolfe
Editor
Editor Jeremy Wolfe joined the FleetOwner team in February 2024. He graduated from the University of Wisconsin-Stevens Point with majors in English and Philosophy. He previously served as Editor for Endeavor Business Media's Water Group publications.


