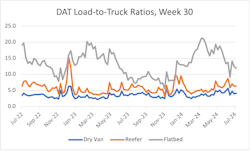
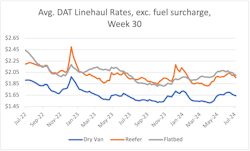
Week over week, last week's loads and rates were down for all three equipment types. On a year-over-year basis, however, rates for the dry van and flatbed segments performed well, according to weekly market reports from DAT Freight & Analytics and FTR Transportation Intelligence.
Loads were up for flatbed
Both firms found that the number of dry van and refrigerated loads fell on a weekly and yearly basis—but the number of flatbed loads increased compared to last year.
The number of dry van load postings on DAT One decreased by 2% compared to the previous week and by 11% compared to last year. Meanwhile, the number of available dry van equipment posts fell slightly further than load posts, down 6% week over week. This raised DAT’s dry van load-to-truck ratio to an impressive 4.1.
"At 4.1, the national average dry van load-to-truck ratio is the highest for Week 30 in eight years, except for the pandemic year of 2020, when it was 4.2," Dean Croke, DAT's principal analyst, said.
DAT’s measure of refrigerated spot market postings saw similar declines: Reefer load postings decreased 3% week over week and decreased 14% year over year. This drop is, in part, due to year-over-year declines in produce volumes nationwide. Equipment posts fell further, down 8% from the previous week and down 21% year over year, bringing the reefer load-to-truck ratio up to 6.35.
Flatbed postings on DAT One fared better: Load postings dropped 5% week over week but rose 8% year over year. Load postings for the week were still 37% lower than DAT’s measured eight-year average for the week’s flatbed load postings. Equipment posts also fell, down 4% from the previous week, bringing the flatbed load-to-truck ratio down to 11.9.
FTR found similar trends in load activity on Truckstop: load post counts were down year over year for dry van and refrigerated, but up for flatbed. However, the firm’s reported y-o-y rise in flatbed posts was significantly higher.
FTR reported that total load activity on Truckstop increased 2.5% week over week and increased 11% year over year. Total load activity was still 24% below FTR’s five-year average for the week. Available truck postings, meanwhile, increased 5% week over week.
FTR’s count of dry van load postings fell 1.1% week over week and fell 8% year over year. Refrigerated load posts decreased 3.1% from the previous week and 7% from the previous year. Flatbed posts rose 5.3% week over week and a whopping 38% year over year, which was FTR’s strongest year-over-year comparison for flatbed since the end of 2021. However, FTR noted that flatbed loads were still 23% below the week’s five-year average.
See also: Latest freight index: The start of recovery?
Dry van rates improved over last year
According to DAT, rates were up year over year for only dry van loads—but, according to FTR, broker-posted rates were up year over year for both dry van and refrigerated loads.
DAT's average dry van linehaul rate was $1.64 per mile, down 1 cent from the previous week but up by 4 cents from the previous year.
The firm's average refrigerated linehaul rate was just under $1.96 per mile, down by 5 cents week over week and down 3 cents year over year. DAT's Croke noted that declining produce volumes are partly to blame for declining rates.
"At $1.96 per mile, the average reefer linehaul rate was 3 cents lower year over year and 2 cents lower than the three-month trailing average," Croke said. "Weak produce shipments have affected demand for reefer trucks: The U.S. Department of Agriculture reports that truckload produce volumes for Week 30 are among the lowest in 10 years."
DAT's average flatbed linehaul rate was slightly over $2.00 per mile, down 2 cents week over week and down 4 cents year over year. However, compared to this same week in 2019, the average flatbed rate was up by 7 cents.
While DAT reported some year-over-year declines, FTR found greater year-over-year improvements. According to FTR, rates were still slightly down week over week but had actually increased year over year. The total average broker-posted rate on Truckstop fell by about 1 cent per mile from the previous week but was nearly 1.4% above the same 2023 week.
For dry van loads, the average broker-posted rate in Truckstop had decreased 1.6 cents week over week but increased by 1.6% year over year. The average reefer rate decreased almost 3 cents from the previous week but was up about 2% from last year. The average flatbed rate was down 2 cents week over week and down 0.2% year over year.
About the Author
Jeremy Wolfe
Editor
Editor Jeremy Wolfe joined the FleetOwner team in February 2024. He graduated from the University of Wisconsin-Stevens Point with majors in English and Philosophy. He previously served as Editor for Endeavor Business Media's Water Group publications.


