Milestone rate improvements signal freight recession receding
For-hire trucking’s September market data paints an attractive picture. The market upturn is near—if not already here. Average contract and spot rates hit milestone improvements not seen in a long time.
Several firms are calling it: the freight recession is ending. Reports from DAT Freight & Analytics, ACT Research, and Cass Information Systems suspect rates will likely begin to improve, slowly and steadily, in early 2025.
“September showed we’re firmly into a new freight cycle after nearly 22 months of rather extreme expansion and 27 months of contraction,” Ken Adamo, chief of analytics for DAT, said. “We expect seasonality to provide some tailwinds over the next few months, and hopefully modest improvements in rates coupled with retail freight volumes and stable fuel prices can get the motor carrier base on more solid footing.”
See also: What are you doing to mitigate 'nuclear' risks to your fleet?
For-hire trucking rates showed little dollars-and-cents growth but reached several major year-over-year milestones. A quarterly report from U.S. Bank affirms an ending freight recession. Volumes, meanwhile, remained in a choppy environment, as ACT Research and the American Trucking Associations report.
Rates show beginning of a freight upturn
Rates did not skyrocket; they hardly improved. Still, September was momentous for rates. Several firms agreed that the month brought rate improvement milestones that stood out across months and even years.
DAT Freight & Analytics recorded some of the best year-over-year comparisons since 2022. ACT Research found one of the only two months—in the last 24 months—where rates showed growth. Cass Information Systems saw the first rates index increase in four months.
This good news suggests a long-awaited improvement in trucking’s economic cycle. The monthly reports from DAT, ACT, and Cass each speculate that a rate upturn is coming—likely in early 2025.
DAT found milestone rate improvements
DAT’s monthly data heralded September as “a new freight cycle.”
The month brought significant milestones for average spot and contract rates; the greatest year-over-year comparisons in roughly two years. September was the first month that all three equipment types’ average spot rates showed positive year-over-year growth since March 2022.
“Monthly national average spot van, reefer, and flatbed rates all turned positive year over year in September,” DAT’s Adamo said. “It’s not a dramatic upswing, but even modest improvements in rates coupled with retail freight volumes and stable fuel prices can get the motor carrier base on more solid footing ahead of the end-of-year holiday season.”
See also: Five technology trends driving vehicle mapping and navigation
DAT’s average spot linehaul rates for dry van, reefer, and flatbed loads, utilizing data from DAT One, showed improvement last month. All three average rates in September were equal to August’s average rates—but marked the first simultaneous year-over-year improvement in two years.
The average dry van spot linehaul rate in September was $1.59, 2 cents higher than last year’s. The average reefer rate was $1.95, up 3 cents year over year. Flatbed rates averaged $1.92, up 6 cents from the previous year.
DAT’s measure of contract linehaul rates showed greater month-over-month comparisons than year-over-year, though both comparisons showed substantial improvement.
The average dry van spot contract rate was $2.01, up 2 cents from August and down 1 cent from last year. Reefer contract rates averaged $2.31, up 1 cent from last month and down 7 cents from the previous year. Flatbed rates averaged $2.58, equal to the last month and up 9 cents from 2023.
Contract rates had their own annual comparison milestones. Dry van contract rates had their highest year-over-year comparison since August 2022, reefer rates the highest since January 2023, and flatbed the highest since June 2022.
The slow rate of improvement suggests a steady upturn in the next freight cycle.
“Entering Q4, we’re finally seeing equilibrium with truckload supply and demand, especially in the spot market,” Adamo said. “The shape and feel of this new cycle will probably be more like 2013 to 2017 than the rollercoaster ride of 2018 to 2022, which included the ELD mandate, a manufacturing recession, and unpredictable supply shocks and inflation due to the COVID pandemic.”
ACT’s pricing index hits best score in years
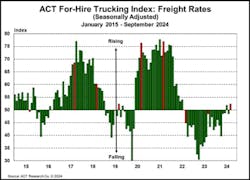
ACT Research’s For-Hire Trucking Index found that September’s rate environment was the best in years. ACT’s seasonally adjusted pricing index rose by 3.9 points, from 48.5 in August to 52.4 in September.
ACT’s pricing index suggests for-hire rates degraded for a long period: September was only the second pricing index score above 50 in 24 months. The first score above 50 was July of this year at 51.8. September’s score is the highest since the index fell below 50 in 2022.
The For-Hire Trucking Index is a monthly measure of seasonally adjusted market changes based on surveyed carriers. A score above 50 represents growth, while a score below 50 represents degradation.
ACT stated that some of the pricing increase came from constrained capacity due to the port strike and hurricanes, though a gradual rate recovery seems likely for 2025.
Cass rate index finally rises
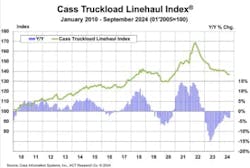
Cass Information Systems' Truckload Linehaul Index found an improvement in for-hire truckload rates for the first time in months.
The linehaul index rose 0.3% month over month to 137.10, the first increase after four months of declines. Year over year, however, September’s linehaul index is down 3.5%. The index has recorded consistent (and often large) year-over-year negatives since 2023.
The report’s author, Tim Denoyer, senior analyst for ACT Research, noted that spot rates have started to increase while contract bids remain very competitive. Denoyer suggested a positive year-over-year index score is unlikely until early 2025.
Truck freight volumes are mixed
While rates hit major milestones, truck freight volumes remain mixed. Volume indices in 2024 continued to alternate between improvement and deterioration.
DAT: volumes down monthly, up annually
DAT’s Truckload Volume Index, an indicator of loads moved during a month, declined month over month and increased moderately year over year for all three monitored equipment types.
Dry van’s TVI was 271, down 6.9% from August’s 291 but up 5.9% year over year. Reefer’s TVI fell to 208, down 6.7% from August’s 223 but up by 12.4% compared to last year. The flatbed TVI was 272, down 5.6% from August but up 2.3% from 2023.
ATA index bounces down
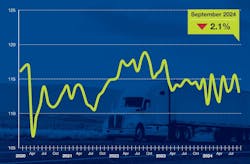
The American Trucking Associations’ seasonally adjusted Truck Tonnage Index fell by 2.6%—from 115.6 in August to 113.2 in September.
“After increasing a total of 2.1% in July and August, tonnage fell by that amount in September,” said ATA Chief Economist Bob Costello. “Freight has been very choppy this year, but despite the latest drop, tonnage is up 1.8% since hitting a low in January. No doubt, the climb up has been slow and difficult as manufacturing activity remains flat, but the trend is up, not down.”
August 2024’s score was the index’s highest level since February 2023. So far this year, the index rose and fell about 2% each month, and the index score increases always rose further than the previous drop.
The score drop resembles last year’s. In September 2023, the seasonally adjusted index fell from 115.2 to 113.9.
ATA bases its tonnage index on membership surveys. A score of 100 represents the association’s 2015 tonnage score.
ACT volume index falls, finds freight demand ‘choppy’
ACT Research’s For-Hire Trucking Index found that seasonally adjusted freight volume demand fell by 5 points—from 54.5 in August to 49.5 in September.
The firm’s volume index bounced dramatically in recent months in an environment the firm called “choppy for-hire demand conditions.” ACT attributed some of the recent variation in volume demand to private fleet growth, two large hurricanes, and a port strike.
U.S. Bank suspects bottom of the freight market is near
U.S. Bank released its quarterly Freight Payment Index this morning. Its findings mirror those among September’s monthly reports. Freight demand and rates are down but the end of freight’s cyclical downturn is coming soon.
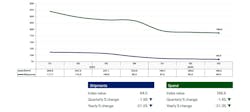
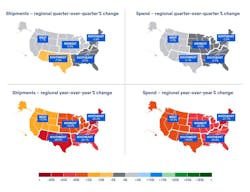
The Freight Payment Index for Q3 2024 found that truck freight shipments and spend continued to decline—but were the smallest declines in the last six quarters.
“While there are positive signs for the freight market, these results are an indication that any recovery will be slow,” the U.S. Bank report said. “The slowing rate of decrease over the last year suggests that the bottom in the freight market is near.”
The bank’s Q3 shipments index fell to 84.0, down 1.9% from the previous quarter and down 21.2 year over year. The Southwest suffered the greatest shipments decrease, dropping 7.2% quarter over quarter and dropping 28.6% year over year. The West suffered the least, with a 1.1% quarterly shipments improvement while falling 10.9% year over year.
See also: Knight-Swift CFO: ‘California was a game changer for us’
Drawing from Federal Reserve data, the bank noted that much of the shipping index declines came from sluggish domestic production. Factory output contracted between 1% and 1.5% from Q2, while durable goods production fell between 2% and 2.5% from last quarter. The U.S. Census Bureau found that new housing unit production fell 5.5% to 6% nationwide—and single-family home starts contracted nearly 10%.
The bank’s spend index showed a similar decline scoring 186.6, a quarterly decline of 1.4%, and a yearly decline of 21.3%.
The drop in spend most impacted the Southeast and Midwest, which fell 3% and 3.3% quarterly, and dropped 22% and 20.3% annually. The West again suffered the least in spend, rising 4.4% quarter over quarter and falling 18% year over year.
The spend index declines largely came from dropping diesel fuel prices, according to U.S. Bank. The Energy Information Administration’s measure of on-highway diesel price averages fell 4.5% from Q2.
Slight deterioration in transportation employment
Driver availability is still high, according to ACT, while the Bureau of Transportation Statistics found a small increase in unemployment for the transportation sector broadly.
Driver availability remains high
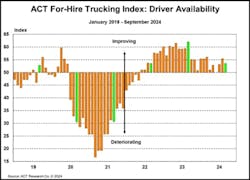
ACT Research’s driver availability index decreased by 1.8 points, from 55.4 in August to 53.6 in September. The firm stated that driver availability is still far from a shortage; September is the 28th month in a row that the driver availability index has been at or above 50.
ACT suggested that its driver availability index will likely fall in the coming months when FMCSA downgrades the CDLs of drivers with a prohibited status in the Drug and Alcohol Clearinghouse. Extended low rates and baby boomer retirements may also lower driver availability.
Transportation unemployment bumps up
The Bureau of Transportation Statistics found that unemployment in the transportation sector rose slightly. Transportation unemployment grew by 0.2 percentage points in September to 5.1%.
Transportation unemployment significantly exceeded BTS’s general U.S. unemployment, which rose to only 3.9% last month. However, BTS’s measure of transportation unemployment includes other modes of transportation (including warehousing) and underrepresents owner-operators.
About the Author
Jeremy Wolfe
Editor
Editor Jeremy Wolfe joined the FleetOwner team in February 2024. He graduated from the University of Wisconsin-Stevens Point with majors in English and Philosophy. He previously served as Editor for Endeavor Business Media's Water Group publications.


