Monthly market data suggests the for-hire trucking economy is improving. Freight rates and volumes continued making year-over-year gains in October, following September’s milestone rate improvements.
The for-hire rate environment improved significantly. DAT Freight & Analytics found that spot rates grew both month over month and year over year. Cass Information Systems recorded its best truckload pricing comparison in years.
See also: FMCSA proposes to bolster carriers' right to broker transparency
“October continued the pattern of year-over-year gains in spot truckload rates and volumes and approaching parity for contract rates,” said Ken Adamo, DAT’s chief of analytics. “Five months into it, the contours of this freight cycle look conventional, like the 2013-2017 cycle, when monthly spot van rates averaged plus 5% year over year.”
Freight volumes improved as well. DAT found year-over-year gains of more than 12%, while the American Trucking Associations’ measure of loads bounced up by 1.2%.
For-hire prices continue improving
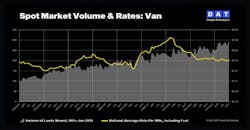
Monthly data from DAT Freight & Analytics suggested spot market rates continued to improve. DAT’s record of contract rates, meanwhile, was still waiting for an upturn.
DAT recorded rising average spot rates both month over month and year over year.
Compared to last month, the average truckload rate for dry van loads increased by 3 cents to $2.02 per mile; reefer rates rose 2 cents to $2.39; flatbed rates jumped 4 cents to $2.42. Compared to last October’s linehaul rates, the spot market performed even better. Dry van rates were 8 cents higher year over year, reefer rates rose by 11 cents, and flatbed rates were up by 10 cents.
DAT’s measure of contract rates was less promising.
Average contract rates inched up month over month but were significantly down year over year. Dry van contract rates averaged $2.41 per mile, up 2 cents from last month but down 10 cents from last year. Reefer contract rates averaged $2.74, up 1 cent month over month but down 22 cents year over year. Flatbed rates remained around $3.04, unchanged from September but 10 cents lower than in 2023.
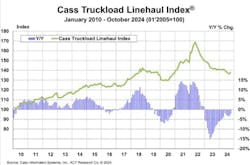
Cass Information Systems’ Truckload Linehaul Index, measuring per-mile truckload pricing, saw its second monthly increase in a row. The Index scored 138 in October, a slight 0.7% increase from the previous month but a 2.2% decline from 2023.
The Cass report’s author, ACT Research senior analyst Tim Denoyer, noted that major for-hire carriers shrank their total tractor counts by 5.9% in Q3 compared to Q2.
“After a long downturn in freight rates, the difference between the 5.9% contraction in capacity and the 2.8% drop in shipments may help explain why TL rates have started to rise, if only by a little,” Denoyer said.
Though only up by 0.7%, October’s value brought the Cass index’s greatest month-over-month gain in 29 months. The Truckload Linehaul Index has seen consistent year-over-year declines for 22 months.
Freight volumes rising
DAT found that freight volumes grew in October. DAT’s Truckload Volume index, which measures the number of loads in a month, increased for all three tracked equipment types.
Dry van volumes rose 9% month over month and 12% year over year. Reefer volumes grew 7% from the previous month and 13% from last year. Flatbed volumes jumped 12% month over month and 14% from last year.
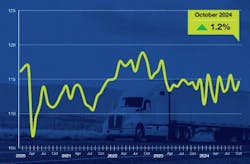
The American Trucking Associations also found freight volume improvements among its members. ATA’s seasonally adjusted Truck Tonnage Index rose 1.2% in October to 114.6.
The index bounced up and down around 2% each month this year. ATA’s volume index is based on membership surveys and mostly represents contract freight.
“The slow and choppy climb off of the bottom continued in October,” said Bob Costello, ATA’s chief economist. “Since hitting a low in January of this year, tonnage is up a total of 3%, plus the index is up sequentially in three of the last four months. No doubt the freight market has improved—albeit slowly—over the course of the year.”
Transportation unemployment fell
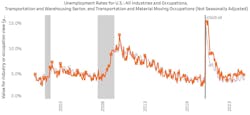
The Bureau of Transportation Statistics found that unemployment in the transportation sector decreased slightly—down 0.4 percentage points to 4.7%. Transportation unemployment still exceeds overall U.S. unemployment, which rose to 3.9% in October.
BTS’s measure of transportation unemployment includes other modes of transportation (including warehousing) and underrepresents owner-operators.
About the Author
Jeremy Wolfe
Editor
Editor Jeremy Wolfe joined the FleetOwner team in February 2024. He graduated from the University of Wisconsin-Stevens Point with majors in English and Philosophy. He previously served as Editor for Endeavor Business Media's Water Group publications.


