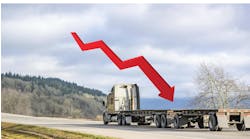
Here’s a gloomy thought: despite the positive projections for freight growth over the next decade being bandied about (though trucking’s share of freight volumes is expected to decline) what if the real long-term trend is far darker and downward in nature?
What I’m talking about here is the decline in overall birth rates in the U.S. – a drop that’s also coupled to declining sperm rates among men in Western nations.
The math is simple, inexorable, and rather scary: fewer babies, of course, ultimately means fewer people. While some climate change ideologues may worship such a trend, declining population numbers would ultimately lead to slower (if not negative) economic growth and less freight – much less a soaring inability to pay for the elaborate welfare systems established in most nations like our own.
John Larkin, managing director and head of transportation capital markets research for Stifel Capital Markets, dug into this perplexing “macro trend” if you will during a presentation at the Truckload Carriers Association (TCA) refrigerated division meeting a few weeks back – and his conclusions don’t add up to a happy ending.
“In some countries, the fertility rate in Europe is 1.3, that’s not enough to … replenish the population of the Earth,” He said. “The fertility rate in the U.S. is starting to drop down as people decide to get married later; maybe having one child, maybe no children, maybe not getting married at all. That has a slowing effect on the rate of economic growth and the rate of food and beverage consumption.”
On top of that, there’s been what Larkin calls a “surprising” change in overall economic productivity in the U.S.; activity that’s been “pretty anemic” over the last couple of years, down below 1%.
“If the fertility rate and the population growth is lower and [we’re] growing less than 1% in productivity, despite of all these electronic gadgets that we have at our fingertips, then can we ever really get back to 2%, 3%, 3.5%, or 4% GDP [gross domestic product] growth? That leaves a big question mark,” he explained.
Larkin also noted that ongoing economic recovery from the Great Recession back in 2008-2009 still remains only at 1.8% and the Federal Reserve is only forecasting a “huge” acceleration to 1.9%.
“That’s not very good; we should be able to do better than that,” he stressed.
So you have to ask yourself this question, Larkin said: what’s slowing the U.S. down? Is it all of the regulations added over the last eight years by the previous Obama administration? Is it slower birth rate? Is it a tax code that punishes success?
“It’s probably a combination of all those things—the aging of the Baby Boomers may play a role there as well, but it keeps getting slower and slower, and part of it may be the law of big numbers,” he explained.
Just look at the GDP growth rates by presidential administration and it becomes clear.
According to the Bureau of Economic Analysis, in terms of average real GDP growth per quarter while in office, under President John F. Kennedy the rate topped 5.5%. Under President Ronald Reagan it fell to 3.64% and while it jumped back up to 3.82% under President Bill Clinton, it fell like a stone to 1.82% under President George W. Bush and then on down to 1.72% under president Barack Obama.
“The rate of economic growth is getting slower and slower and slower; the tax code keeps getting more and more complex; regulations keep getting more and more complex; and it [all] has the retardation effect on the economy,” Larkin noted. “That means that maybe our children have less of an opportunity than we had. They may be the first generation that has less opportunity than the prior generation and that’s sad commentary, at least for me.”Then you need to look at falling economic productivity and what the real unemployment numbers are in the U.S.
“If we look at unemployment, it’s easy to pound your chest and look at the U3 number, which is the number that is published by mainstream media in general. It’s down there at a pretty low 4% range [it just hit 4.3% according to the U.S. Department of Labor] and most economists will tell you that’s very close to full employment,” Larkin pointed out. “But U6 is really a better number and that’s still rather high; up around 9% or maybe a touch less. Basically, what U6 includes is: people that are under-employed; people that went to college but are working as a landscaper, a cashier at a hotel, or a Starbucks barista; those folks who work part-time who would like a full-time job.”
He added that Obamacare promoted an increase in a lot of part time jobs, because if you work less than 29 hours you’re not required to provide health insurance to that employee.
“The rest of the story is that the labor participation rate has really fallen pretty dramatically from 67% to something like 62 to 63%,” Larkin stressed. “We would need 11.2 million more working men and women in the U.S. to get back to where we were at the peak in the late 1990’s. That’s a lot of people to get to work.”
Add all of that up and you get some pretty depressing long-term trends – not just for freight volumes and the trucking industry, but for American society as a whole. But trends are not written in stone and the future is not set. And frankly, the world is full of surprises. Let’s hope we get surprised where the trends above are concerned.


