Wage and benefit increases resulting from a shortage of drivers were mostly responsible for higher average operating costs for trucking companies in 2013, according to new research released by the American Transportation Research Institute (ATRI). But owing to a significant drop in costs per mile in 2012, the average marginal costs per mile remain 3 cents lower than in 2011, the research found.
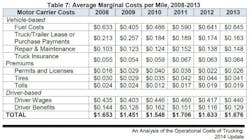
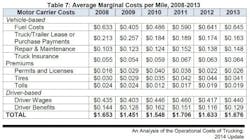
The 2014 update to “An Analysis of the Operational Costs of Trucking,” which identifies trucking costs from 2008 through 2013 based on carriers’ financial and operating data, found that the average marginal cost per mile in 2013 was $1.676 – up from $1.633 cents from 2012.
ATRI’s research found that driver-related costs represented 3.6 cents of the 4.3-cent total increase in average marginal cost per mile. Driver wages were up 2.3 cents per mile while driver benefits were up 1.3 cents per mile. Average driver pay for survey respondents was 44 cents per mile. LTL drivers’ pay averaged 53.9 cents per mile while specialized and truckload carriers reported average pay of 45 cents and 39 cents, respectively.
The two driver-related costs were by far the largest increases from 2012 to 2013, ATRI found. The next-largest increase was 1 cent per mile for repair and maintenance, which essentially offset a 1.1-cent drop in truck/trailer purchase and lease payments per mile.
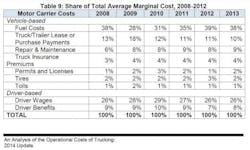
Meanwhile, the share of total marginal costs per mile represented by each line item was virtually unchanged from 2012 to 2013 and little changed from 2011 as well, ATRI found. Fuel costs and driver wages represented 38% and 26%, respectively, and purchase/lease payments, repair and maintenance and driver benefits bunched together at 10%, 9% and 8%.
ATRI found steady increases in marginal operating costs per mile in 2010 and 2012 – 9.7 cents and 15.8 cents, respectively – after costs dropped by 20.2 cents in 2009 from 2008. That decline was fully attributable to the collapse in diesel prices after an all-time high of $4.76 per gallon in July 2008.
ATRI’s announcement referred to a “slight decrease” in 2012. That drop from 2011 was 7.3 cents – a significantly larger change than the 4.3-cent increase in 2013 over 2012. In announcing last year’s findings, ATRI said the decline in marginal operating costs likely were due to the weak economic recovery and softening freight conditions experienced in the second half of 2012.
Other findings
In addition to financial information and the demographic data needed to analyze it, ATRI asked a few questions of more topical interest, including three for the first time about electronic logging devices (ELDs), equipment trade cycles and primary commodities hauled. In the topic questions – two of which were repeated from last year – ATRI found that:
- 53% of carriers reported using ELDs to monitor hours-of-service compliance for at least some of their drivers
- Carriers on average hold tractors for 6.6 years and trailers for 12.2 years
- 25% of carriers haul primarily general freight while 19% haul refrigerated food and 9% manufactured goods
- Approximately 4% of respondents reported using vehicles that ran on a fuel other than diesel or biodiesel, up from 2% in 2012. All of the reported vehicles ran on compressed natural gas.
- 87% use speed limiters. Of those that do so, 51% use limiters on all trucks, and 41% use them on 70% to 99% of their fleet
For a copy of the ATRI report, click here.


