If there’s one thing—and maybe the only thing—the Dept. of Transportation and the diverse trucking industry agree on, it’s the need to attract more people—especially the next generation—to truck driving careers. So the timing is indeed unfortunate for a Dept. of Labor economist to portray driving trucks as among the most dangerous jobs in the U.S., “risky in ways you might not expect.” This comes just as the Federal Motor Carrier Safety Administration is launching a pilot program to explore the possibility of allowing 18-21 year olds to drive in interstate commerce, among other pro-driver efforts for DOT: Left hand, meet the right hand.
The DOL blog, “Truck Driver Job-Related Injuries in Overdrive,” opens by suggesting that “tractor-trailer truck drivers probably don’t come to mind” when people consider dangerous jobs like police officer and firefighter, but the statistics call for a closer look. As bulleted in the blog post:
- One out of every six American workers killed on the job is a tractor-trailer truck driver.
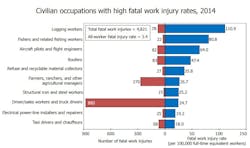
- In 2014 alone, 761 tractor-trailer truck drivers were killed while working, which also marks the fifth year in a row that the number of truck driver fatalities has increased.
- The vast majority of these deaths, 78 percent, were caused by transportation incidents.
The blog then goes on to add some perspective, comparing truck driver death, injury, and illness to the working population as a whole.
Well, we know what they say about statistics, so let’s take a closer look. First, as someone who has to spend way too much time digging through various government databases, I can attest that no two federal agencies measure things in the same way. And it gets especially tricky when, for instance, someone from the DOL starts throwing around “civilian” terms that mean something different in the language of a specialized industry, such as trucking. (ATRI’s Dan Murray, bless him, jumped all over this in a comment on the blog page, concluding that the author should “leave DC for a day, climb into a class 8 truck for the first time, and see what the real story is out on the roads.”)
More troubling than nomenclature, however, is the breezy tone of authority—especially since the same DOL economist did a much more thorough analysis of the available data a year-and-a-half ago. It’s a straightforward, academic, “just the facts, ma’am” report—which means it’s nearly impossible to read. So, hey, let’s turn the latest data into a blog—then we don’t have to be clear and factual.
Still, let’s try to make sense of this as best we can.
As to the 761 fatalities (from which the 1 in 6 point is made), that is indeed the total for Standard Occupational Classification (SOC) #53-3032 Heavy and Tractor-Trailer Truck Drivers from the report, Fatal Occupational Injuries by Selected Characteristics, 2003-2014 (page 45—yes, I looked it up). But if we skip down to pages 86-87, we see another series of trucking categories based on the North American Industry Classification System, including long-distance truckload (NAICS #484121, 139 fatalities) and LTL (NAICS # 484122, 24 fatalities)—more along the lines of what Fleet Owner readers would consider “tractor-trailer” drivers. This isn’t to discount the fatalities and injuries of truck drivers in logging, mining, and construction, or local delivery, but those are different jobs with different challenges—and, typically, not subject to FMCSA regulations. For those still keeping score, and just to add to the category confusion, FMCSA maintains its own set of Large Truck and Bus Crash Facts, based on the Fatality Analysis Reporting System (FARS). In this version of the data, there were 657 large truck occupant fatalities in 2014.
As to increasing fatalities for the last five years, that’s correct for the broadly inclusive SOC totals, while the NAICS and FARS totals increased in three of the last five years. But what the totals don’t take into account is the surge in trucking activity since the recession. For simplicity’s sake, I’ve made a chart (above) using the FARS data—and it shows that the truck driver/occupant fatality rate has crept up since 2010, but is hovering near an historical low.
Additionally, the blog emphasizes the 761 fatality total but fails to mention that there are 3 million or so truck drivers. A DOL chart (at right) puts it into perspective, showing that it’s actually more dangerous to be a farmer than a trucker.
I haven’t gone into as much detail on the work-related injury figures referred to in the blog, because I’m not as familiar with the trends—but I will concede they don’t look good for trucking. These charts, even though they pertain to the broader category of truck drivers, are startling, and the blogger could be correct in suggesting employers need to improve the working conditions for truck drivers. Or, as we well know, it’s just a darn tough job.
Thoughts?


