Fleet miles between breakdowns improve as maintenance costs rise
CLEVELAND, Ohio—In an unusual benchmarking quarter, fleets experienced an increase of miles between breakdowns, and higher maintenance and labor costs, based on the findings of two reports announced at the American Trucking Associations’ Technology & Maintenance Council (TMC) Fall Meeting & Transportation Technology Exhibition.
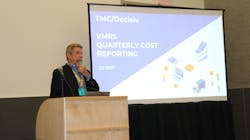
Paul Gildenhorn, VP of customer solutions for FleetNet America, presented the second-quarter 2021 results of the TMC and FleetNet America Vertical Benchmarking Study on Sept. 12 during TMC. The study, which looks at truckload, less-than-truckload (LTL), and tanker verticals, analyzes miles between breakdowns and miles between repairs.
Q2 2021 reveals a 2% increase in the miles between breakdowns from Q1 2021. That’s compared to a 13.6% decrease in miles between breakdowns early in the same quarter of 2020.
“This is a very odd quarter to be benchmarking against because Q2 2020 is when the economy shut down,” Gildenhorn said. “Trucks were parked, especially within the LTL and the tanker fleets, while truckload carriers saw high demand.”
According to the study, truckload carriers averaged 23,769 miles between breakdowns, LTL fleets averaged 46,180 miles between breakdowns, and tanker fleets averaged 18,241 miles between breakdowns.
Participating truckload fleets saw a 148% improvement in miles between breakdowns from 2019 to 2021 and 17% improvement from 2020 to 2021. The improvement over the same period in 2020 showed a slight increase of 2.5% in miles between breakdowns. A best-in-class participating fleet was 64% better than the vertical average.
LTL saw a 5% improvement in miles between breakdowns over Q1 2021, compared to an 11% decline in miles between breakdowns from Q2 2020 when trucks were parked and utilization was down. The best-in-class LTL fleet ran 25% more miles between breakdowns than the vertical average.
Tanker fleets saw a 1.5% improvement in miles between breakdowns in Q1 2021, compared to a 22% decline from the same period in 2020. Again, low utilization caused the discrepancy and improvement in miles between breakdowns year over year, Gildenhorn explained. The best-in-class tanker fleet was 164% better than the vertical average.
When looking at TMC’s vehicle maintenance reporting standards (VMRS), the top five roadside repairs for Q2 2021 accounted for some 70% of roadside repairs:
- Tires averaged 74,854 miles between breakdowns.
- Brakes averaged 285,000 miles between breakdowns.
- Powerplants averaged 562,000 miles between breakdowns.
- Brake systems averaged 725,000 miles between breakdowns.
- Cranking systems averaged 902,000 miles between breakdowns.
VMRS coding and an uptick in costs
A Decisiv Inc./TMC North American Service Event Benchmark Report shows that maintenance and repair labor costs increased 2.6% between Q1 and Q2 2021, while parts costs increased by 2.8%. In that same period, parts costs for tires increased by 10.7% and transmission parts costs rose 9%, according to the report.
The report covers power unit parts and labor costs in nine VMRS level code categories that comprise roughly 69% of the cost of parts and labor for Q2 2021: brakes, steering, tires, transmissions, electrical, charging, lighting, exhaust, and engines. Parts and labor pricing revealed three significant changes between Q2 2020 and Q2 2021: Lighting systems costs increased 17.4%, transmissions costs increased 16.4%, and brake costs increased 11.1%.
Earlier this year, Decisiv Inc. and TMC announced a partnership to produce a benchmarking tool designed to track key performance indicators for commercial vehicle parts and labor based on the council’s VMRS.
Decisiv manages more than 7 million commercial vehicles that engage in more than 300,000 service events a month. The company collects information on the cost of labor and cost of parts, and Mark Wasilko, Decisiv’s VP of marketing, stressed that the accurate VMRS coding benefits the entire industry.
Expanding on the 300,000 service events that Decisiv engages in each month, with two to three operations per service event, that equates to around 615,000 monthly service-related operations, Nick Pittinger, Decisiv’s senior manager of data science and analytics, pointed out.
“That’s a huge number of data and work collected around the details happening on the trucks when they are coming into a shop for service,” Pittinger said. “What we found is that dealers aren’t as great as they could be about populating the VMRS codes for those service events within the platform. For the VMRS system codes specifically, we found 83,000 cases or service events can have those codes provided by the dealers. That makes up about 10-15% of the operations they are actually handling for their customers.”
Wasilko added that service providers have been notoriously poor at paying attention to or delivering encoded operations.
“It hasn’t changed much,” he said. “These guys at TMC have been after them for a long time. The fleets have been after them for a long time. There’s not enough financial or personal incentive for them to drive that change in behavior. That’s part of the reason we are spending time over the encoding capacity.”
To fill the void, Decisiv went on to build a process to automatically encode up to 464,000 of those 615,000 operations, Pittinger added.
“We are capturing an enormous amount of data about how services occur and what takes place on vehicles, and we are just moving into another phase around taking that data and turning it into intelligence and actionable information,” Dick Hyatt, Decisiv CEO, explained. “Intelligent service management is the next wave of all this. We set out to take the data that we collected and use machine learning and AI to take the unstructured data, analyze that, and derive a VMRS code from the unstructured data.”
About the Author

Cristina Commendatore
Cristina Commendatore is a past FleetOwner editor-in-chief. She wrote for the publication from 2015 to 2023.
