Refrigeratedtransporter 1554 Spot Mkt Tally August Chart

Spot market freight volume recedes 8.8% in August 2015

Sept. 17, 2015
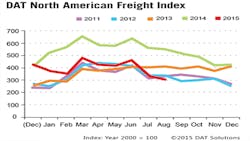
Following a common seasonal pattern, spot market freight volume declined 8.8% month-over-month in August 2015, according to the DAT North American Freight Index.

Following a common seasonal pattern, spot market freight volume declined 8.8% month-over-month in August 2015, according to the DAT North American Freight Index. The index fell from July to August in four of the past 10 years. This year’s autumn freight season, which sometimes begins in mid-August, appears to be starting a few weeks later, DAT Solutions reported.

By equipment type, van freight levels dropped 3.7% month-over-month, refrigerated freight edged down 0.4%, and flatbeds were off 18%, for an overall decrease of 8.8% compared with July. Early indications suggest improving van and reefer freight availability in September.

Compared with the extraordinary volume of 2014, August freight was down 44%. Volume for August also fell below same-month totals for the past four years, but freight availability remained strong versus the previous five-year period, from 2005 through 2010, which included a recession.

Line haul rates on the spot market followed the month-over-month volume trends by equipment type, falling 1.3% for vans, 2.7% for reefers, and 2.2% for flatbeds. However, the average total rate paid to carriers dropped more steeply, due to lower diesel prices that yielded a 14% reduction in the fuel surcharge versus July. Carriers are typically paid a sum of the line haul rate and the fuel surcharge, on a per-mile basis. With fuel included, the total rate decreased 3.3% for both vans and flatbeds, and fell 4.2% for reefers.

Comparing freight volume to August 2014 by equipment type, year-over-year, vans retreated 35%, reefers were down 29%, and flatbeds dropped 57%. Line haul rates lost only 1.3% for vans, while reefer rates dipped 1.1% and flatbeds fell 5.8% compared with August 2014, but total rates declined by 11% to 15% due to a 49% drop in the fuel surcharge over the year.

Intermediaries and carriers across North America listed more than 120 million loads and trucks in 2014 on the DAT network of load boards. As a result of this high volume, the DAT Freight Index is representative of the ups and downs in North American spot market freight movement. In 2015, DAT reformulated the index with 2000 as the baseline year.

Access www.dat.com for more information.
Voice your opinion!

To join the conversation, and become an exclusive member of FleetOwner, create an account today!

Sponsored Recommendations

Trucking KPIs on Autopilot: Optimize Performance with a TMS

Discover 7 essential KPIs that will revolutionize your fleet's performance. From cost-per-mile to shipment volume, learn how a TMS can put your profits on autopilot. Unlock the...

Unlock the Road to Ultimate Fleet Safety with our Infographic

Discover how to improve your fleet safety program with our interactive infographic, "The Journey to Fleet Safety". Learn essential steps and best practices to reduce accidents...

Commercial telematics: Boosting safety, productivity and cost-efficiency

As 2G and 3G networks retire, commercial telematics will increasingly focus on 4G and 5G cellular connectivity. The next generation of telematics hardware includes telematics ...

The Role of AI in Transportation Audits, Compliance, and Risk Management

AI Enhancement versus AI Replacement? That is the question many fleets and suppliers are facing nowadays with the continued trend of technological advancements. Learn why Fleetworthy...