Reefer, van rates skyrocket during Fourth of July holiday week
Spot truckload freight rates shot up to new heights at the end of June, only to skyrocket further during the Fourth of July holiday week.
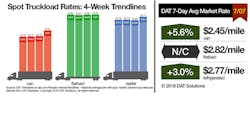
The national average spot van rate on the DAT network of load boards increased 13 cents to $2.45/mile during the week ending July 7, 2018, while the refrigerated rate gained 8 cents to $2.77/mile. The flatbed rate was unchanged compared with the previous week at $2.82/mile.
As rates set records, a 32% decline in the number of available loads and an 11% drop in capacity reflected the short workweek the week ending July 7 and exceptionally high volumes during the final week of June.
Reefer load posts on DAT load boards fell 33% while truck posts were down 4%. That caused the load-to-truck ratio to decrease from 13.2 to 9.3 reefer loads per truck. While the national rate rose, several markets showed signs of settling:
•Elizabeth NJ—$2.19/mile, down 20 cents
•Philadelphia—$3.35/mile, down 32 cents
•Atlanta—$3.39/mile, down 14 cents
•Miami—$2.35/mile, down 8 cents
•Green Bay WI—$3.94/mile, down 40 cents
•Dallas—$2.90/mile, down 10 cents
California remained a bright spot for spot reefer rates, led by Los Angeles, up 16 cents to an average of $3.78/mile the week ending July 7.
The number of van load posts was down 26% while truck posts dropped 12%, which cause the load-to-truck ratio to fall from 9.2 to 7.7 loads per truck. Weekly average spot rates climbed on 55 of the Top 100 van lanes. Forty-three lanes were down and two were neutral; most rate declines were small, however. In the past four weeks, van rates have risen 6.5% in the Top 100 lanes.
The national load-to-truck ratio for flatbeds retreated for the fourth week in a row, down to 52.9 loads per truck. That’s still high, but it’s less than half the early-June level of 109 loads per truck. There was a 37% decrease in the number of flatbed loads and a 19% drop in truck posts the week ending July 7. The national average flatbed rate held steady.
DAT Trendlines is generated using DAT RateView, a service that provides real-time reports on prevailing spot market and contract rates, as well as historical rate and capacity trends. RateView’s database consists of more than $45 billion in freight bills in 65,000-plus lanes. DAT load boards average 993,000 load posts per business day.
For the latest spot market load availability and rate information, go to www.dat.com/trendlines.
