Traffic congestion is down nationally, yet its cost increased by 15% YoY
Congestion in large metro areas and along interstates nationwide costs the nation billions of dollars annually for both commuters and the commercial trucking industry, according to the American Transportation Research Institute’s latest congestion report, Congestion to the Trucking Industry: 2024 Update. While the hours spent idle sitting in traffic fell more than 5% from 2021 to 2022 (the most recent data available), the overall year-over-year cost of congestion rose 15%.
See also: Trucking congestion costs set industry record, topping $94.6 billion
Congestion is a national problem
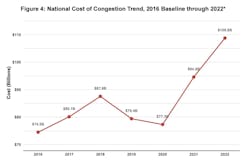
On a nationwide scale, congestion cost the trucking industry a whopping $108.8 billion in 2022, dethroning 2021 as the year with the highest cost of congestion at $94.6 billion.
The culprit responsible for the sharp upturn in congestion costs during a year of less congestion—which we’ll get into—is no surprise. Inflation soared by 7.8% between 2021 and 2022, according to the U.S. Census Bureau. This inflation hit the trucking industry even harder in 2022, when, according to ATRI, the costs of operating a truck increased 21.6% year over year. This means that while fewer hours were spent stuck in traffic, each hour sitting idle cost the industry more than it did in 2021.
While fewer hours spent in traffic is a silver lining that shouldn’t be ignored, a 5% improvement isn’t much to celebrate considering drivers lost 1.2 billion hours in traffic in 2022. This is “equivalent to 435,686 truck drivers sitting in idle for an entire year” or “idling 22% of all Class-A licensed truck drivers,” ATRI’s report states.
As for the cost of congestion to the trucking industry, ATRI estimates congestion cost owner-operators and carriers $7,588 per truck in 2022.
Hours spent idling also contribute to wasted fuel. Using its own data as well as data from American Trucking Associations and Oak Ridge National Laboratory, ATRI estimates that the 1,198,137,472 hours lost to congestion resulted in the consumption of 6,424,413,123 gal. of diesel fuel. In other words, drivers wasted $32.05 billion of fuel in 2022, assuming the average annual diesel price of $4.989 per gallon that year.
See also: Uncovering the hidden costs of truck idling that eat away at your bottom line
Congestion analysis by state
The costs of congestion vary by state, and population density plays a role. In fact, according to ATRI’s report, the top four states where traffic congestion costs the most also top the list for highest population.
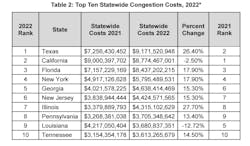
Texas, the second-most populated state, took the crown in 2022 for the state where congestion costs are the highest. While it rose just one spot in the rankings from the previous year, it experienced a 26.4% increase in congestion costs year over year.
California, the most populated state, moved down in the rankings from 2021 to No. 2 in 2022. While its total costs of congestion remain high (with a total cost of $8,774,467,001), the state did achieve a 2.5% decrease in overall congestion costs from 2021 to 2022. It is one of only two states in the top 10 that achieved a decrease in costs along with No. 9 Louisiana with a 12.72% decrease in congestion costs. Table 2 shows a complete list of the top 10 states with the highest costs of congestion.
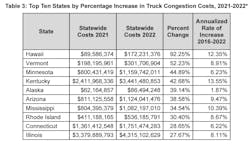
ATRI also included statistics for states with the highest percentage increases. While only one of the states in this list are also in the top 10 for congestion costs (Illinois), the changes in individual states’ costs of congestion are significant. Hawaii’s congestion costs nearly doubled year-over-year at 92.25%.
Congestion analysis by metro area
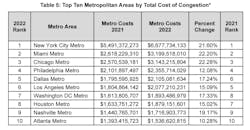
Because population density plays such a role in congestion, it’s helpful to understand the costs of congestion per metro area as well. ATRI analyzed 106 major metro areas for 2022. While the same metro areas exist in the top 10 list for 2022 as they did in 2021, their order changed slightly.
The slight changes took place in the rankings of 5, 6, 7, and 8, as reflected in Table 5.
See also: Congestion pricing is coming back to NYC
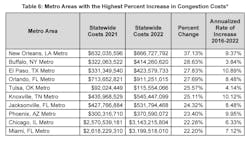
The top metro areas with the highest percentage increase are listed in Table 6. Buffalo and Tulsa’s increases could be attributed to a rebound back to post-pandemic numbers, ATRI states, as both metro areas returned to congestion levels similar to those in 2019.
New Orleans, which ranked No. 1 for the highest percentage increase in congestion costs (37.13%), experienced an increase in truck activity in 2022, as the Port of New Orleans “doubled its breakbulk volumes, added 1 million TEUs of container capacity, and nearly doubled its cold storage facilities,” the report states.
Overall, ATRI found that of the 106 metro areas analyzed, 92 of them saw either no change or fewer hours of congestion. ATRI chocks this up to the softening of the freight market the industry experienced in 2022.

