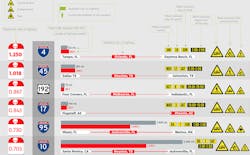
January is the most dangerous month to be traveling on Interstate 4 in Florida, which runs between Tampa and Daytona Beach. The most likely day of the month for there to be a deadly accident on that span is the 10th. Sunday is the worst day of the week for the 132 miles between Tampa and Daytona Beach. And the worst hour to be on I-4 is from 2 to 3 a.m.
Knowing what roads to avoid and when to avoid them could be the difference between arriving on time or not arriving at all. Teletrac Navman has put that all together in a sharp infographic chock full of information on where and when more fatal traffic deaths occur.
Interstate 4 is the deadliest highway in America with 1.25 deaths per mile from 2011 to 2015. It is one of only two U.S. highways with more than one death per mile, according to an impressive infographic created by Teletrac Navman, a GPS fleet management company.
Nearly 100 people a day were killed in traffic accidents in the United States in 2015, according to Fatal Accident Reporting System data compiled by the National Highway Traffic Safety Administration. Of the 35,092 traffic fatalities in 2015, 10,396 took place on U.S. highways and interstates.
Teletrac Navman’s extensive and lengthy infographic, “The 25 Most Dangerous Highways in the United States Calculated by Fatalities Per Mile,” is based on an analysis of fatality data gathered for the U.S. numbered highway routes and Interstate Highway system from 2011-2015.
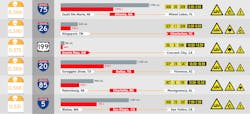
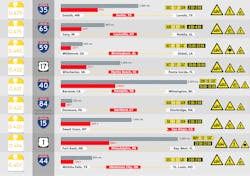
The map accompanying the infographic not only shows which highways are the deadliest — ranking them based on the deaths per mile — but also which month, calendar day, day of the week and hour of the day are the most common for a fatal accident. Along with this, Teletrac Navman notes which city along the highway is the deadliest part of the road (Orlando, for example, is the most dangerous part of I-4 in Florida). And the graphic also breaks down what the three most common harmful events are.
Along I-4, the most common harmful event is two motor vehicles colliding, which could include a moving car colliding with an illegally parked vehicle along the highway. Overturned vehicles are the 2nd most likely cause of a fatal accident on I-4, and pedestrians are third.
The six deadliest highways — those with at least 0.7 deaths per mile over the five-year study — are roads run along the Eastern Seaboard and the Southern states:
1. I-4 (Tampa, FL to Daytona Beach, FL): 1.25 deaths per mile
Deadliest city: Orlando
2. I-45 (Dallas, TX to Galveston, TX): 1.02 deaths per mile
Deadliest city: Houston
3. US 192 (Four Corners, FL to Indialantic, FL): 0.87 deaths per mile
Deadliest city: Melbourne, FL
4. I-17 (Flagstaff, AZ to Phoenix, AZ): 0.84 deaths per mile
Deadliest city: Phoenix
5. I-95 (Miami, FL to Weston, MA): 0.73 deaths per mile
Deadliest city: Jacksonville, FL
6. I-10 (Santa Monica, CA to Jacksonville, FL): 0.7 deaths per mile
Deadliest city: Houston
Three of the next four deadliest highways — those with at least 0.6 deaths per mile from 2011 to 2015 — are in Texas:
7. US 175 (Dallas, TX to Jacksonville, TX): 0.69 deaths per mile
Deadliest city: Dallas
8. I-37 (San Antonio, TX to Corpus Christi, TX): 0.65 deaths per mile
Deadliest city: San Antonio
9. US 290 (Junction, TX to Houston, TX): 0.63 deaths per mile
Deadliest city: Austin, TX
10. I-78 (Union Township, PA to New York City): 0.63 deaths per mile
Deadliest city: Jersey City, NJ
The six next deadliest highways — those with between 0.5 and 0.599 deaths per mile — includes some Western and Midwestern roads but also see the worst sections in the South:
11. I-75 (Sault Ste. Marie, MI to Miami Lakes, FL): 0.599 deaths per mile
Deadliest city: Atlanta, GA
12. I-26 (Kingsport, TN to Charleston, SC): 0.59 deaths per mile
Deadliest city: Charleston
13. US 199 (Grant Pass, OR to Crescent City, CA): 0.58 deaths per mile
Deadliest city: Grants Pass
14. I-20 (Scroggins Draw, TX to Florence, SC): 0.57 deaths per mile
Deadliest city: Dallas
15. I-85 (Petersburg, VA to Montgomery, AL): 0.57 deaths per mile
Deadliest city: Charlotte, NC
16. I-5 (Blaine, WA to San Ysidro, CA): 0.53 deaths per mile
Deadliest city: San Diego
The final nine deadliest cities on the list — those with between 0.4 and 0.49 deaths per mile — include more Midwest and Western routes but still see some of the most dangerous sections in the East and South:
17. I-35 (Duluth, MN to Laredo, TX): 0.48 deaths per mile
Deadliest city: Austin, TX
18. I-65 (Gary, IN to Mobile, AL): 0.48 deaths per mile
Deadliest city: Louisville, KY
19. I-59 (Wildwood, GA to Slidell, LA): 0.47 deaths per mile
Deadliest city: Birmingham, AL
20. US 17 (Winchester, VA to Punta Gorda, FL): 0.43 deaths per mile
Deadliest city: Myrtle Beach, SC
21. I-40 (Barstow, CA to Wilmington, NC): 0.43 deaths per mile
Deadliest city: Memphis, TN
22. I-84 (Dunmore, PA to Sturbridge, MA): 0.42 deaths per mile
Deadliest city: Hartford, CT
23. I-15 (Sweet Grass, MT to San Diego, CA): 0.42 deaths per mile
Deadliest city: San Diego
24. US 1 (Fort Kent, ME to Key West, FL): 0.41 deaths per mile
Deadliest city: Philadelphia
25. I-44 (Wichita Falls, TX to St. Louis, MO): 0.41 deaths per mile
Deadliest city: Oklahoma City
While this morbid list and graphic might make it look like the U.S. is a dangerous place to travel, compared to the rest of the world, it is not. According to the World Health Organization, the U.S. is among the 25 safest countries to drive, based on total fatalities per billion kilometers driven, Teletrac Navman, points out.
About the Author
Josh Fisher
Editor-in-Chief
Editor-in-Chief Josh Fisher has been with FleetOwner since 2017. He covers everything from modern fleet management to operational efficiency, artificial intelligence, autonomous trucking, alternative fuels and powertrains, regulations, and emerging transportation technology. Based in Maryland, he writes the Lane Shift Ahead column about the changing North American transportation landscape.


