Three studies find the states where driving is considered the riskiest
Getting from point A to B involves much more than simply typing a destination into a navigation system. Multiple factors must be considered, such as bridge laws, traffic patterns, tolls, weather events, and more.
It’s also worth noting if some roads pose different risks than others.
Read on to discover the states with the most challenging roads to navigate, the least acceptable roads, and those with the highest fatality rates per traffic accident. While the information was compiled by three different studies from two personal injury law firms and surveyed road conditions and traffic statistics at large, fleets can benefit from the information.
States where navigation is the most challenging
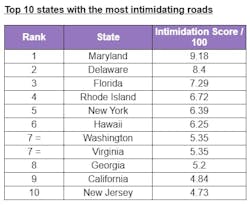
A study from Foster Wallace, a personal injury law firm, analyzed data from 50 states, giving each an “intimidation index” score. The intimidation index was determined by including factors such as the state’s number of roundabouts, speed cameras, and traffic volume. The score is ranked from zero to 100, with zero being the least intimidating. Here are the top five:
1. Maryland
Foster Wallace crowned Maryland as the most intimidating state to drive in. It scored 9.18 on a scale of 100. According to the study results, the state has the highest number of roundabouts per 1,000 miles of public roads at 17.16.
It also has the highest density of speed cameras per 1,000 miles at 31.47. Finally, the state has a heavy traffic volume, with 1,742.17 million vehicle miles traveled per 1,000 miles of public road.
2. Delaware
Study results conclude Delaware is the second most intimidating state for drivers, granting the state a score of 8.4 out of 100. It has 15.97 roundabouts per 1,000 miles of public road, 21.44 speed cameras per 1,000 miles of road, and a significant volume of traffic at 1,501.44 million vehicle miles traveled per 1,000 miles.
3. Florida
Florida comes in third for the most intimidating state to drive. It received a score of 7.29 out of 100. It has 12.82 roundabouts per 1,000 miles. Its speed camera presence is significantly lower than the other states that rank in the top five for most intimidating roads (3.86 per 1,000 miles), but its volume of traffic makes up for it. Florida’s traffic volume is 1,839.46 million vehicle miles traveled per 1,000 miles.
4. Rhode Island
Small it may be, Rhode Island has been designated as intimidating, according to study results. The state ranks fourth for most intimidating to drive, with a score of 6.27 out of 100. Rhode Island has a high concentration of speed cameras at 19.45 per 1,000 miles and 3.98 roundabouts per 1,000 miles. It experiences heavy traffic volumes at 1,153.12 million vehicle miles traveled per 1,000 miles.
5. New York
Rounding out the top five most intimidating states to drive is New York, with a score of 6.39 out of 100. New York has the second-highest density of speed cameras at 27.83 cameras per 1,000 miles. It has 1,008.37 million vehicle miles traveled per 1,000 miles of road and 2.25 roundabouts per 1,000 miles of road.
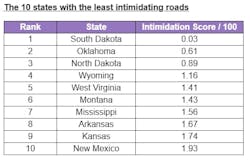
The state considered the least intimidating is South Dakota, with a score of 0.03 out of 100. It has 0.22 roundabouts per 1,000 miles of road, no speed cameras, and a traffic volume of 124.41 million vehicle miles traveled per 1,000 miles.
See also: 2024 International Roadcheck results lead to more questions
States with the worst roads
A vehicle’s longevity is affected by the quality of the roads it travels, and poor-quality roads could lead to more vehicle breakdowns due to excessive wear and tear.
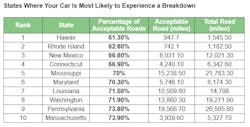
The Fitch Law Firm, an Ohio-based personal injury law firm, collected data from the U.S. Bureau of Transportation Statistics and identified the states with the lowest percentage of “acceptable” miles. “Acceptable” miles were scored using an International Roughness Index. Scores of 170 or greater are considered “unacceptable,” and IRI scores less than 170 indicate a better-quality road, contributing to less wear and tear on vehicles.
Here are the states with the poorest-quality roads:
1. Hawaii
Hawaii is considered the state where motorists are most likely to experience a breakdown due to poor road conditions. Only 61.3% of Hawaii’s roads are identified as acceptable, with 597.8 miles of the 1,545.5 miles of road analyzed having an IRI of more than 170.
2. Rhode Island
Rhode Island is the second state most likely to cause a vehicle breakdown due to its unacceptable roads, as only 62.8% of its roads are considered acceptable, with only 742.1 acceptable miles out of a total 1,182.50 miles analyzed.
3. New Mexico
New Mexico comes in at third for states where roads will most likely cause breakdowns, with only 66.8% of its roads considered acceptable. This equates to only 8,031.1 acceptable miles of the total 12,021.3 miles analyzed in the state.
4. Connecticut
Ranking quite close to New Mexico is Connecticut, with only 66.9% of its roads designated as acceptable. Just 4,240.1 miles of the 6,342.6 miles analyzed in the state are considered acceptable.
5. Mississippi
Finally, Mississippi rounds out the top five states with roads most likely to cause breakdowns. Only 70% of its roads are considered acceptable, leaving 30% more liable to cause damage from wear and tear. Of its 21,783.30 total miles, Mississippi has only 15,238.50 acceptable miles.
“Awareness of difficult road conditions means drivers can anticipate potential mechanical issues, adjust their routes, or perhaps be prepared for the possibility of a breakdown,” a spokesperson for The Fitch Law Firm said about the findings. “This can help reduce the risk of unexpected vehicle troubles during a journey.”
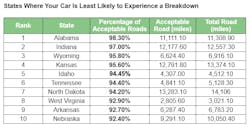
There are some states with great-quality roads, however. Alabama, Indiana, Wyoming, Kansas, and Idaho all have roads that are more than 95% acceptable.
See also: States with the largest decrease in fatal truck accidents
States with the highest fatality rates
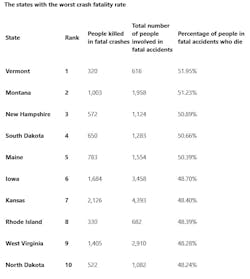
The same Ohio-based personal injury law firm that conducted the acceptable roads study, The Fitch Law Firm, conducted a study on the states with the highest percentage of fatalities occurring from traffic accidents.
Analyzing National Highway Traffic Safety Administration data from 2017 to 2021, The Fitch Law Firm identified the 10 states where fatality rates are the highest when involved in a dangerous crash.
The national average fatality rate for traffic accidents stands at 44.16%, which helps to understand the severity of the study’s results.
Here are the states with the five highest fatality rates involving traffic accidents:
1. Vermont
Vermont leads the nation with its percentage of fatalities per traffic accident. Approximately 320 of 616 (or 51.95%) of those involved in a fatal crash succumb to injuries.
2. Montana
Montana is the second-highest state with the percentage of fatalities per traffic accident at 51.23%. According to the data, 1,003 deaths occurred out of 1,958 people involved in traffic accidents.
3. New Hampshire
In third is New Hampshire with a fatality rate of 50.89%. Data indicates the state experienced 572 fatalities out of 1,124 people involved in an accident from 2017 to 2021.
4. South Dakota
South Dakota is fourth, with a fatality rate of 50.66%. Of 1,283 people involved in a fatal traffic accident, 650 succumbed to injuries.
5. Maine
Maine rounds out the five states with the highest fatality rate with traffic accidents. It has a rate of 50.39%, with 783 deaths out of 1,554 people involved in fatal traffic accidents.
States with the lowest fatality rate with traffic accidents include: Utah, with the lowest rate at 40.81%; New Mexico, with the second-lowest fatality rate at 41.61%; Florida, with the third-lowest fatality rate at 41.75%; Nevada, with a rate of 41.78%; and finally, Arizona with a fatality rate of 41.81%.
About the Author
Jade Brasher
Senior Editor Jade Brasher has covered vocational trucking and fleets since 2018. A graduate of The University of Alabama with a degree in journalism, Jade enjoys telling stories about the people behind the wheel and the intricate processes of the ever-evolving trucking industry.

