The Federal Motor Carrier Safety Administration (FMCSA) has looked closely at its own fundamental safety evaluation program and determined the agency is doing a pretty good job, given the challenges of its mission and the limited resources at its disposal.
On Thursday FMCSA released a Congressionally directed report that shows the amount of data used in the agency’s Safety Measurement System (SMS) is “clearly sufficient” to allow FMCSA to identify high-risk trucking companies, the agency said in a news release.
The report comes as Congress considers legislation aimed at reforming FMCSA, its regulatory agenda, and safety scoring model. The self-analysis also refutes critical oversight reports from the Government Accountability Office (GAO) and the Dept. of Transportation’s Office of the Inspector General. Additionally, trade groups including American Trucking Assns., the Owner-Operator Independent Drivers Assn., the National Private Truck Council, and the Truckload Carriers Assn., have called for the the Compliance, Safety, Accountability (CSA) carrier rankings to be removed from public view due to questions over the scoring system and the underlying data.
Among the shortcomings pointed out in Washington and by the industry, only 200,000 of the 525,000 active carriers in the system have enough inspection data to be ranked in the rolling 24-month scoring calculations at the heart of the Compliance, Safety, Accountability (CSA) program. But the report found that SMS identifies the carriers involved in 90 percent of the more than 100,000 crashes that occur each year, and those that are identified as high-risk carriers continue to have crash rates that are twice the national average.
Another concern has been that the scoring system—which requires 3 to 5 inspections for a ranking in one of the safety categories (BASICs)—is unfair to the small trucking companies who do get scored. GAO, in a February 2014 review that was the basis for testimony before the Senate last March, posed an alternative methodology would limit the use of safety performance data for assessing risk only to carriers that undergo 20 or more roadside inspections.
The FMCSA report finds, however, that if the number of inspections required for prioritization was increased to 20 or more, only about 52,000 carriers (10 percent) could be identified for proactive interventions.
“FMCSA’s prioritization tool would then be skewed towards the largest motor carriers,” the report states. “While larger companies have more crashes due to their exposure, as a group, they have lower crash rates (crash risk) than smaller motor carriers. Ignoring the readily apparent lapses in smaller carriers’ safety management controls, while focusing only on larger carriers, limits the agency’s ability to reduce crash risk on our highways.”
The analysis revealed no significant difference in actual crash rates between small carriers and those with 20 or more roadside inspections.
FMCSA also noted that the category of carriers with 11-20 inspections and patterns of non-compliance has the highest crash rates, “presenting a clear and immediate intervention opportunity” to bring those carriers into compliance.
“FMCSA’s current SMS data sufficiency standards allow the agency to effectively identify and proactively intervene with high-risk carriers before a crash involving a large truck or bus occurs,” the agency emphasizes.
Safety in numbers
Trucking companies also contend that the system mischaracterizes many of them because the data and SMS score rankings do not predict the future crash rate of individual motor carriers. But that’s not the goal of the system, FMCSA explains.
“The goal is to identify carriers that engage in patterns of behavior that are similar to carriers that are involved in crashes, which is standard risk management practice,” the agency summary says. “The crash rates of the groups of carriers identified is more than twice the national average. SMS data is sufficiently reliable for FMCSA to identify groups of high-risk carriers for intervention.”
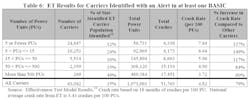
Indeed, according to the report, FMCSA has conducted SMS "effectiveness testing" (ET) to assess how well SMS identifies patterns of non-compliance and the correlated crash risk. The test uses historical data to compare carriers’ non-compliance for a period of time in the past and then observes the carriers’ subsequent crash involvement. FMCSA most recently completed the ET in 2014.
“This analysis has consistently demonstrated the strength of the system,” FMCSA says. (See the chart above.)
“FMCSA regulates a larger and more diverse constituency than any other mode within the Department of Transportation. We must continue to balance our programs across this diversity,” the report concludes. “The agency takes its responsibility to correct safety problems extremely seriously and will continue to adjust regulations, programs, and systems to make the greatest possible impacts. We cannot sit back and wait for more violations before taking action on motor carriers. It is our responsibility to identify non-compliance and take appropriate actions.”
A copy of the report is here.


