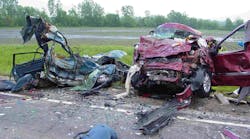
The National Safety Council (NSC) released a new report this week that indicates there’s a big gap in motor vehicle crash data being recorded by law enforcement officials in most states.
It’s a gap so large that it’s the equivalent of saying “the Emperor has no clothes,” except in this case, that lack of fictional clothing may be obscuring efforts to get at why so many more people are now dying in crashes.
[You can read more about that data reporting gap by clicking here.]
Indeed, preliminary estimates from the NSC indicate as many as 40,000 people died in car crashes last year – a 6% increase over 2015 and a 14% increase over 2014, which is an uptick the group describes as “the most dramatic two-year escalation since 1964.”
I talked to Deborah Hersman, NSC’s president and CEO, late last year about some of the trend lines surrounding this uptick in motor vehicle crash deaths, particularly when it comes to drug-impaired driving – especially in light of the push by many states to legalize marijuana, though that is not the only drug of concern.
“Marijuana is of course a huge issue,” Hersman told me. “There’s a lot of comparison with alcohol [legalization] but it’s really not the same. For example, the effects of alcohol have been widely studied; we know the BAC [blood alcohol content] impairment levels for men and women.”
[You can read the full story that includes her comments by clicking here.]
Marijuana, however, offers a different challenge as it can be smoked or ingested. Meanwhile, the potency of the marijuana being grown and sold today – in terms of its active ingredient, THC – is much, much greater than the marijuana grown and sold four or five decades ago.
“What constitutes impairment? What constitutes a ‘cut off point’ in marijuana use before operating a motor vehicle?” Hersman asked rhetorically. “The drug also affects people differently and it packs more of a punch today.”
Then there is the opioid crisis; a far scarier drug problem to Hersman’s mind that the widespread legalization of marijuana, in terms of impaired driving.
“We now know there’s a high risk of abuse; these drugs [opioids] are dangerous because they are prescribed by a doctor so many think they are OK – that they are safe,” she said.
In Hersman’s view, a truck driver is far more likely to be at risk of opioid addiction versus marijuana abuse because the truck driver population is older and the nature of the work can lead to injuries.
Now how is any of this related to the aforementioned “data gap” in vehicle crash investigations? Well, according to NSC, 32 states lack spots on their crash reports to identify specific types of drugs if drugs are detected in the people involved in a crash, including marijuana.
That means that drugged driving could possibly account for many more of the 40,000 vehicle fatalities in 2016 than we realize.
And it’s not just about the loss of life on our highways alone, Hersman stressed to me – it’s about broader societal costs as well, in terms of injuries and the resulting healthcare costs, lost wages, lower economic productivity, etc.
Indeed, a study compiled by the National Highway Traffic Safety Administration (NHTSA) estimates that vehicle crashes generate nearly $871 billion in economic loss and societal harm every year in the U.S. – and that study (you can access it by clicking here) is based on 2010 data.To add to the gloom, here’s a breakdown of those costs:
- Vehicle crashes generated $277 billion in economic costs and $594 billion in harm from the loss of life and the pain and decreased quality of life due to injuries in 2010.
- Nearly 75% of the economic cost of crashes is paid through taxes, insurance premiums, and congestion related costs such as travel delay, excess fuel consumption, and increased environmental impacts. These costs, borne by society rather than individual crash victims, totaled over $200 billion.
- Crashes caused by drivers under the influence of alcohol accounted for 18% of the total economic loss due to motor vehicle crashes and cost the nation $49 billion. Including lost quality of life, these crashes were responsible for $199 billion or 23% of the overall societal harm caused by motor vehicle crashes.
- Crashes involving a speeding vehicle traveling over the posted speed limit or too fast for conditions accounted for 21% of the total economic loss and cost the nation $59 billion in 2010. Including lost quality of life, these crashes were responsible for $210 billion or 24% of the overall societal harm caused by motor vehicle crashes.
- Crashes involving a distracted driver accounted for 17% of the total economic loss and cost the nation $46 billion in 2010. Including lost quality of life, these crashes were responsible for $129 billion or 15% of the overall societal harm caused by motor vehicle crashes.
It just goes to show that to figure out how to start stemming the rising red tide of motor vehicle crash deaths, as well as the red ink associated with them, we need to start getting better data about them when they occur. Otherwise it’ll be like trying to win a boxing match blindfolded.


