A new study released by the National Highway Traffic Safety Administration (NHTSA) calculates that vehicle crashes generate nearly $871 billion in economic loss and societal harm every year – a price tag that some safety advocates claim acts almost as a “hidden tax.”
"The costs of crashes continue to be a hidden tax on the American public,” David Kelly, former acting administrator for NHTSA under President George W. Bush and currently president of safety consulting firm Storm King Strategies, told Fleet Owner.
“Unfortunately, we have become complacent about decreasing highway fatalities and accept this tax,” he added. “We need to stand together and use everything at our disposal to reduce fatalities."
NHTSA's study – entitled The Economic and Societal Impact of Motor Vehicle Crashes – is based on the analysis of 32,999 fatalities, 3.9 million non-fatal injuries, and 24 million damaged vehicles resulting from crashes that occurred in 2010. Key findings include:
- Vehicle crashes generate nearly $871 billion in economic loss and societal harm every year, including $277 billion in economic costs – nearly $900 for each person living in the U.S. based on calendar year 2010 data — and $594 billion in harm from the loss of life and the pain and decreased quality of life due to injuries.
- The economic cost of motor vehicle crashes in the U.S. is the equivalent of 1.9% of the $14.96 trillion U.S. gross domestic product (GDP) in 2010. Factors contributing to the price tag include productivity losses, property damage, medical and rehabilitation costs, congestion costs, legal and court costs, emergency services, insurance administration costs, and the costs to employers, among others.
- Nearly 75% of the economic cost of crashes is paid through taxes, insurance premiums, and congestion related costs such as travel delay, excess fuel consumption, and increased environmental impacts. These costs, borne by society rather than individual crash victims, totaled over $200 billion.
- Crashes caused by drivers under the influence of alcohol accounted for 18% of the total economic loss due to motor vehicle crashes and cost the nation $49 billion; an average cost of $158 for every person in the U.S. Including lost quality of life, these crashes were responsible for $199 billion or 23% of the overall societal harm caused by motor vehicle crashes. Over 90% of these costs occurred in crashes involving a drunk driver with a blood alcohol concentration (BAC) of .08 or higher.
- Crashes involving a speeding vehicle traveling over the posted speed limit or too fast for conditions accounted for 21% of the total economic loss and cost the nation $59 billion in 2010; an average cost of $191 for every person in the U.S. Including lost quality of life, these crashes were responsible for $210 billion or 24% of the overall societal harm caused by motor vehicle crashes.
- Crashes involving a distracted driver accounted for 17% of the total economic loss and cost the nation $46 billion in 2010; an average cost of $148 for every person in the U.S. Including lost quality of life, these crashes were responsible for $129 billion or 15 percent of the overall societal harm caused by motor vehicle crashes.
On the plus side, however, NHTSA’s research found that seatbelt use prevented $69 billion in medical care, lost productivity, and other injury related costs. Conversely, though, preventable fatalities and injuries to unbelted occupants accounted for 5% of the total economic loss from vehicle crashes and cost the nation $14 billion in 2010.
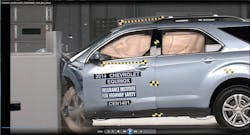
[In order to broaden the understanding of how safety technologies are tested for effectiveness, the Insurance Institute for Highway Safety (IIHS) developed the video below to show how it documents vehicle crash tests.]
Including lost quality of life, failure to wear seatbelts caused $72 billion or 8% of the overall societal harm caused by motor vehicle crashes in 2010, noted U.S. Transportation Secretary Anthony Foxx in a statement.
"No amount of money can replace the life of a loved one, or stem the suffering associated with motor vehicle crashes," he added. "While the economic and societal costs of crashes are staggering, today's report clearly demonstrates that investments in safety are worth every penny used to reduce the frequency and severity of these tragic events."
Related research by the National Safety Council (NSC) highlights that motor vehicle crashes play a large role in the fifth leading cause of death in the U.S. – unintentional injuries. Every four minutes someone in the U.S dies from an unintentional injury, NSC said – equating to 120,000 people a year.
Some 67% of all injury-related deaths in the U.S. are due to unintentional causes, compared to just 9% to homicide, with the top three causes of unintentional injury in the U.S. being poisoning, motor vehicle crashes and falls. And the cost of unintentional injuries to Americans and their employers is almost as high as those of vehicle crashes – exceeding $793 billion nationally, paid in the form of taxes, insurance premiums, medical costs, property damage, lost wages and productivity.
“These statistics are not just numbers; they are our family members,” noted Deborah Hersman, NSC’s president and CEO, in a statement. “It takes all of us, is a call for everyone to make simple changes to prevent tragedy in your home or car. Properly store your medications, put down your phone when you drive and use slip-resistant mats on your floors. These small changes can make a huge difference.”
About the Author
Sean Kilcarr
Editor in Chief
Sean Kilcarr is a former longtime FleetOwner senior editor who wrote for the publication from 2000 to 2018. He served as editor-in-chief from 2017 to 2018.
